
Bitcoin displayed its “Lazarus-like” character once again, rising from apparent death and going on the attack with bulls leading the way. The current target of $12,000 is within reach, even though a majority of analysts keep expecting a correction to be in the immediate vicinity. BTC had been trading sideways for three days, dipping and bouncing between $11,400 and $11,700, but it suddenly moved north by $500 in as little as five minutes. Initial speculation was that shorts were caught flatfooted, losing some $44 million in the process. For now, it has settled in at $11,842 to take a breather.
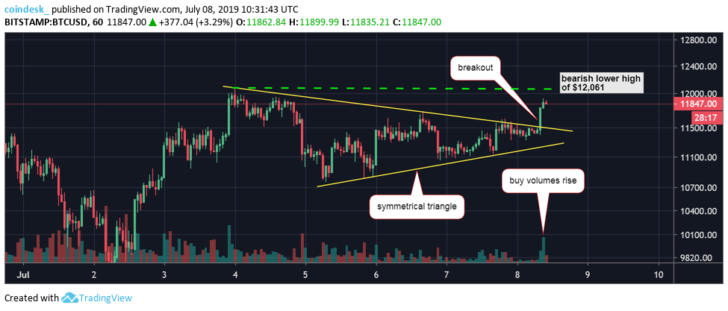
Recent moves have been so quick that analysts are now glued to one-hour charts, or even shorter timeframes to gain insights on what might be next. As the following chart from Coindesk illustrates, Bitcoin has been in the grips of a converging triangle or wedge or whatever your preference is when describing this formation. In traditional technical analysis, the odds favor a breakout in the direction of the previous trend, which is open for interpretation, but the general presumption is that it was an uptrend, although brief.
It may be difficult to believe, but just 30 days ago, Bitcoin was stable at $7,600, before it shot forward in an attempt to surpass all immediate hurdles in its way. This move followed a broad-based belief that June would soon end with a negative result, thereby breaking a four-month winning streak. No sooner had the ink dried, but Bitcoin began another one of its “moonshots”, as some followers termed it, and established a new yearly high of $13,880. With volumes low and indicators screaming overbought conditions, BTC had nowhere to go but down, actually below $10,000 before recovering.
As the world’s favorite cryptocurrency began vibrating about the $11,400 Fibonacci benchmark, the narrative began to return to the “large 30%+ correction” scenario that had been espoused by several analysts back in May. The logical argument was built that the “dead-cat-bounce” experienced on the 2nd and the 3rd was merely a prelude to a further major dip below $8,000. Many hopeful investors, both retail and institutional, were poised for bargain prices, but the bulls and supposed “Whales” were not having it.
The sudden show of life by Bitcoin has sent researchers hunting for a “smoking gun” that would explain the latest burst of energy. A few analysts have fastened onto a theory about the Bitcoin “hash rate”, a measure of miner performance and the amount of computing power that is being committed to the infrastructure. Three days ago, the hash rate hit an all-time-high of 74.5 million tera hashes per second, a figure that has risen more than 100% since the same time last year.
Interestingly enough, respected analysts have differing opinions as to what this record high could mean regarding Bitcoin price behavior. There is agreement that the higher the hash rate, the more secure the blockchain system is. As for pricing impacts, Wall Street trader and journalist Max Keiser regards the hash rate as a leading indicator, implying that a major bull run is in the offing. Renowned crypto analyst and economist Alex Kruger, along with a cast of others, thinks, on the other hand, that the hash rate does not lead price, it follows it. The thinking here is that price rises encourage exuberance in the mining community. Kruger, however, has been touting fundamental drivers in his tweets.
And so, that brings us back to the present to ponder what comes next. Cynics have quieted down a bit amidst the rising tide of good BTC fortune, but Gold Bugs remain the loudest skeptics in town, wishing that investors would drop cryptos and keep the recent yellow metal rally alive. A hint of what is to come is borne out on the above chart. Back on the crossover from the 3rd to the 4th of July, Bitcoin peaked at $12,061. If bulls are truly on the march, then analysts believe that this level must be breached in order to confirm that the Bitcoin train is ready to mount another summit.
The folks over at FXStreet are banking on signals from their proprietary indicator – the Confluence Detector Tool (CFT). They claim that:
Bitcoin has significant support above $10,000: Hinting further growth in the near-term.
Their CFT also suggests that $12,000 is a critical barrier to penetrate, followed by resistance at $12,224. If Bitcoin powers through $13,000, however, there is very little in resistance to blunt another major surge forward. On the downside, if support fails at $11, 481, then BTC could fall as low as $10,700.
As with past surges, there is a great deal of speculation as to its causes and whether Bitcoin has enough steam to wage another assault on loftier territories. The only certainty at this stage, however, is that pricing behavior over the next week will be indicative of what is to come, whether that be up or down.