The new week in the financial markets was influenced mostly by politics and public talks. The Trump-Musk confrontation on twitter (X) had knocked TSLA down for more than 8%: S&P 500 and Nasdaq wobbled without developing expanding volatility. VIX (S&P 500 volatility index) held below 20, which had shown a muted overall trading activity.
The Trump-Musk pattern
The markets now seem to be influenced by “social media wars” and statements. The beginning of the week was affected by US president Donald Trump claiming China was not easy to negotiate (that strengthened the Japanese Yen against the greenback). The second part of the week was mostly dominated by Elon Musk and his statements on twitter. Below is a breakdown of this confrontation in X.
Nowadays a trader should keep an eye on those situations and quickly adapt: cutting off some buying in such situations. Previously, the market was adapting to the so-called “Trump pattern” (increasing volatility, then releasing the tension), now we can talk about “Trump-Musk pattern” already.
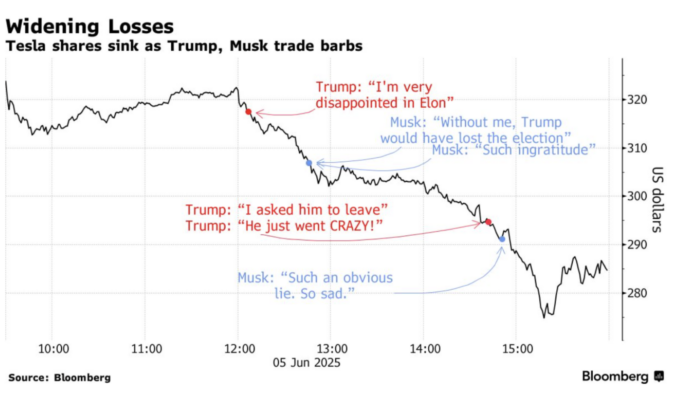
The Trump-Musk confrontation. Source: Bloomberg.com
NFP publication was solid, but not substantial enough: 139k vs 130 anticipated. The reaction of the market was a growth for S&P 500 and US stocks (which fits in the current trend), as the report wasn’t a game changer.
Bonds yields across the globe have been declining, as the level of volatility stabilizes, even despite the political talks. The markets are transitioning to a summer regime: according to historical studies, volatility spikes usually happen in the late July, whereas in June, the price action might be somewhat muted, with absence of news triggers and hot driving narratives.
Probabilities of interest rates for the US point to a one-step decline in September, according to the FEDwatchtool, with a clear bias of more than 50% voting for this scenario, and around 20% for the interest rate kept at the same level.
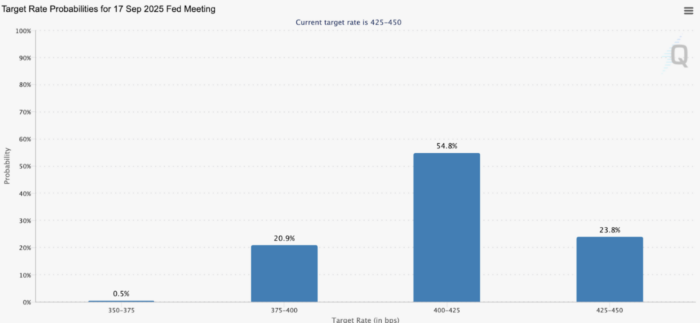
Probabilities of interest rates for September 2025. Source: https://www.cmegroup.com/markets/interest-rates/cme-fedwatch-tool.html
US500
The S&P 500 index is concentrating in the massive triangle below the psychological level of $6000, and given the overall neutral to good market sentiment, it’s not expected to plummet from this area before testing the area of $6000-6200. Should the breakout of this zone happen, it’s not expected to be sustainable and may quickly revert back to the range, as traders are quite cautious right now and the market is prone to liquidations and quick profit taking.
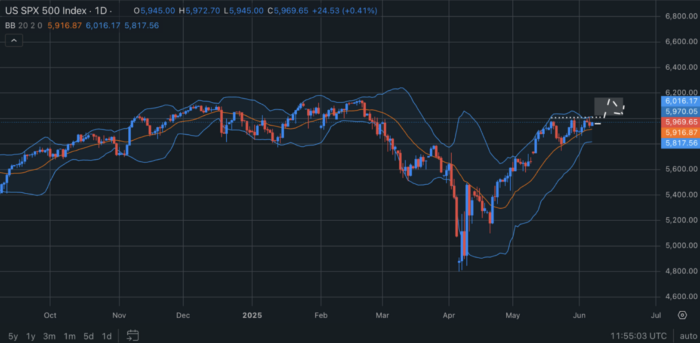
US500. Source: Exness.com
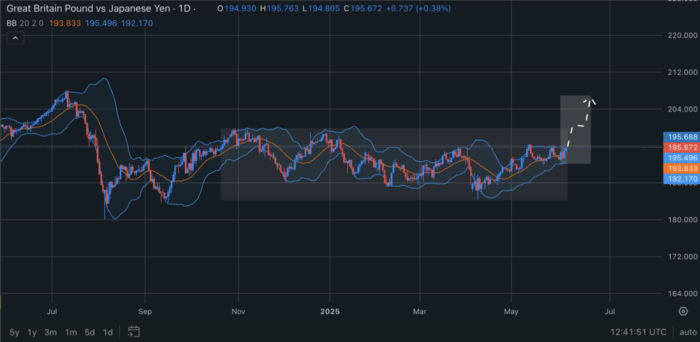
GBPJPY
The interesting storyline may be developing around Japanese Yen and its cross-pairs (especially against European currencies). GBPJPY, for example, is concentrating inside of a massive trading range, as volatility for this pair has dropped to a one-year low.
Yields of 30-year bonds for Japan has been peaking to a historical high, but now they start to rebound. The net position of large speculators for Japanese Yen futures on COT-reports seem to point to the overleveraged situation, which might result to quick unloading of longs and Yen sliding down quickly, which may result in a shakeout of a volatility and rapid breakouts for GBPJPY and similar pairs.