Insights provided by Antreas Themistocleous, an analyst at Exness
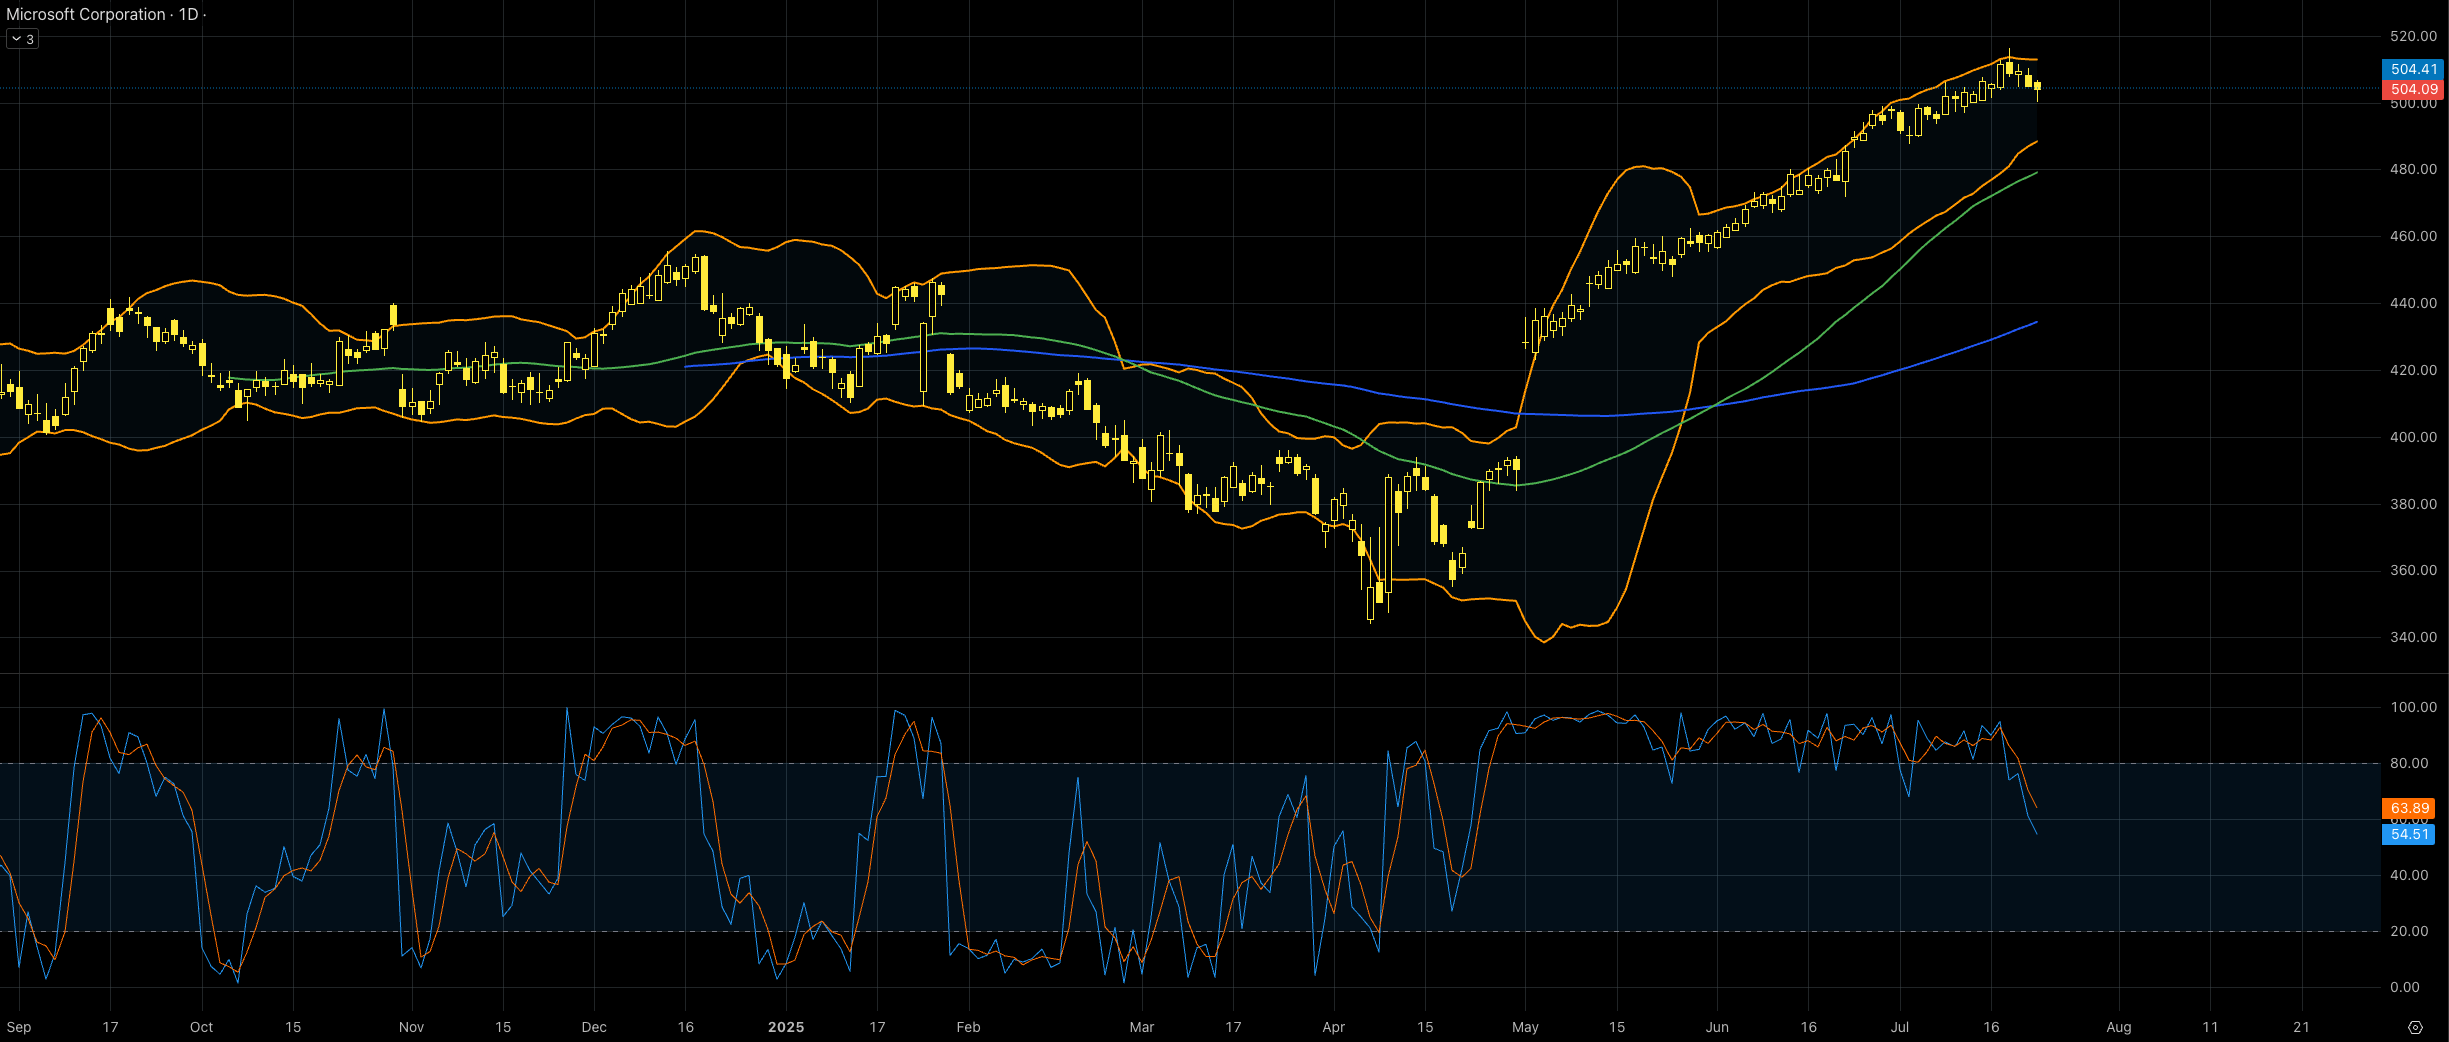
Microsoft Corporation (symbol ‘MSFT’) share price reached a new all-time high on July 17 at $511.70 while on July 18 it even reached $514.64 intraday. The company’s earnings report for the fiscal quarter ending June 2025 is expected to be released on Wednesday, July 30th, after market close. The consensus EPS is $3.35 against $2.95 of the same quarter last year.
Microsoft is still holding its higher market cap compared to its main competitor, Apple, with $3.75 trillion against $3.02 trillion. Recently, Microsoft’s web-based platform “SharePoint” was hijacked, with Microsoft quickly reacting with patches to resolve the issue. As of today, there was no significant effect on the share price, but as the story unfolds, we might see some market reaction.
Technical analysis shows that the price has found sufficient support on the lower band of the Bollinger bands in early April and has since entered a rather aggressive bullish rally until the day of this report being written. As a result of the bullish rally, the Stochastic oscillator has been pushed to extreme overbought levels and has recently corrected to neutral levels, hinting that the price could move in either direction in the near short term. On the other hand, the moving averages are still validating an overall bullish trend in the market while the Bollinger bands are quite contracted, showing that volatility has dried up, and it might take some time to witness any significant moves.
Apple battles resistance area – Can Earnings Turn It Around?
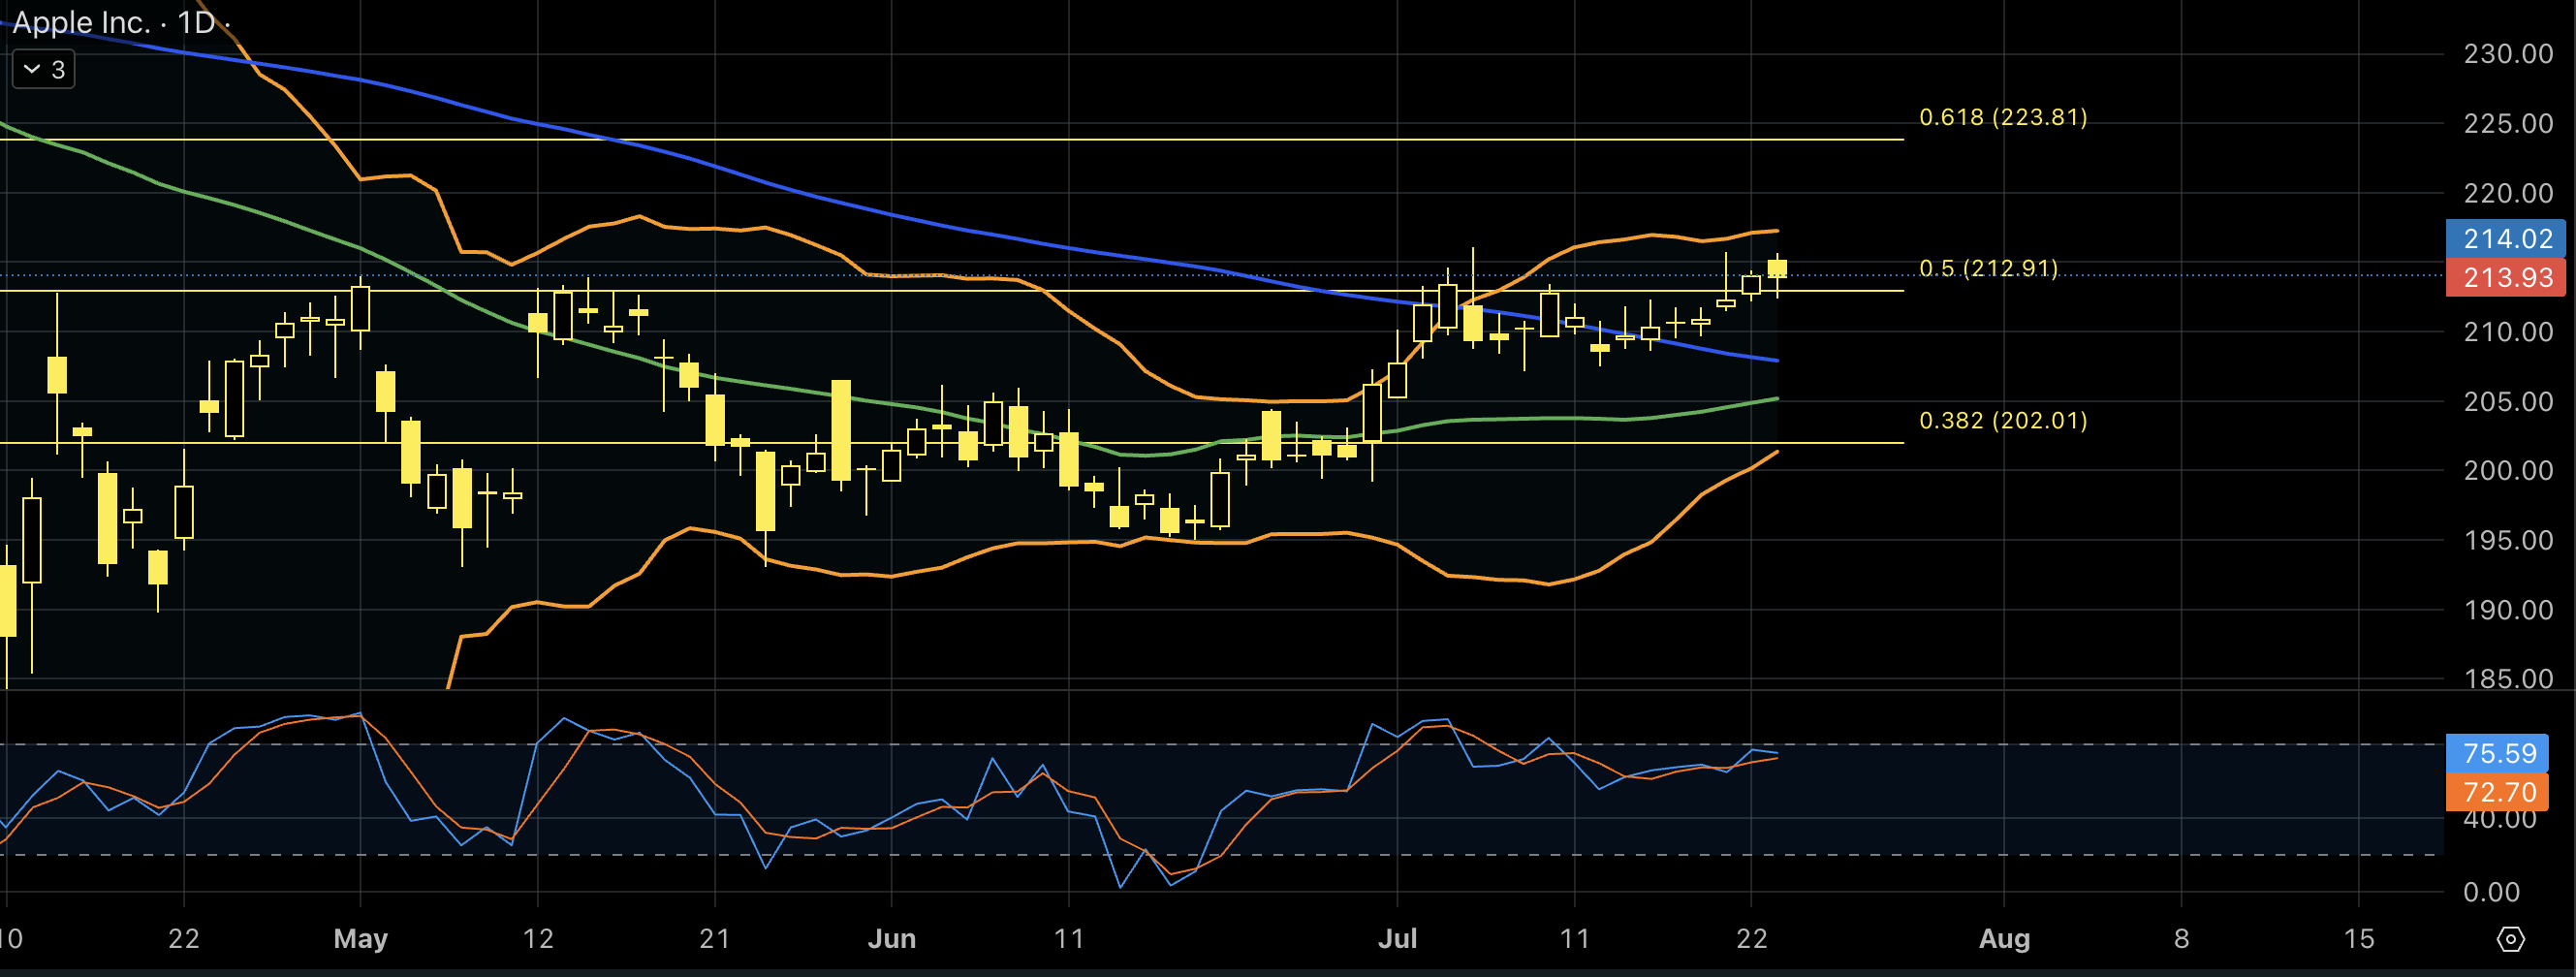
Shares in Apple Inc. (symbol ‘AAPL’) gained back a large percentage of the losses incurred at the beginning of the second quarter. The company’s earnings report for the fiscal quarter ending June 2025 is set to be released on Thursday, 31st of July, after market close. The consensus EPS is $1,42 compared to $1,40 of the same quarter last year.
2025 is a hard year for the company so far since it lost more than 17% of its share value. The recent minor bullish rally might give some hope for a positive overall result at the end of the year, but the price needs to rise above $260 to be considered a positive year, and the company is still far from this number. Also, the financial image of the company is not looking great with the current ratio at 0.82 as of 31 March 2025. This means that the company is not liquid enough to cover the short-term liabilities with the current assets at hand. The payout ratio (percentage of the total earnings of the company paid out as dividends) is at 15,74% indicating that the company is looking forward to keeping most of its earnings for economic growth/strength, which is a good sign for the overall performance of the company.
On the technical side, the price is testing the resistance area between the upper band of the Bollinger bands and the 50% of the weekly Fibonacci retracement level. The level of $212 is also an inside resistance area of price reaction in early May and early July, making it a strong technical resistance level. The Bollinger bands are quite expande,d showing that there is volatility to support big moves. The Stochastic oscillator is near the extreme overbought level, but it’s not in there just yet. On the other hand, the moving averages are still validating an overall bearish trend in the market.