This article was submitted by Antreas Themistokleous, market analyst at Exness.
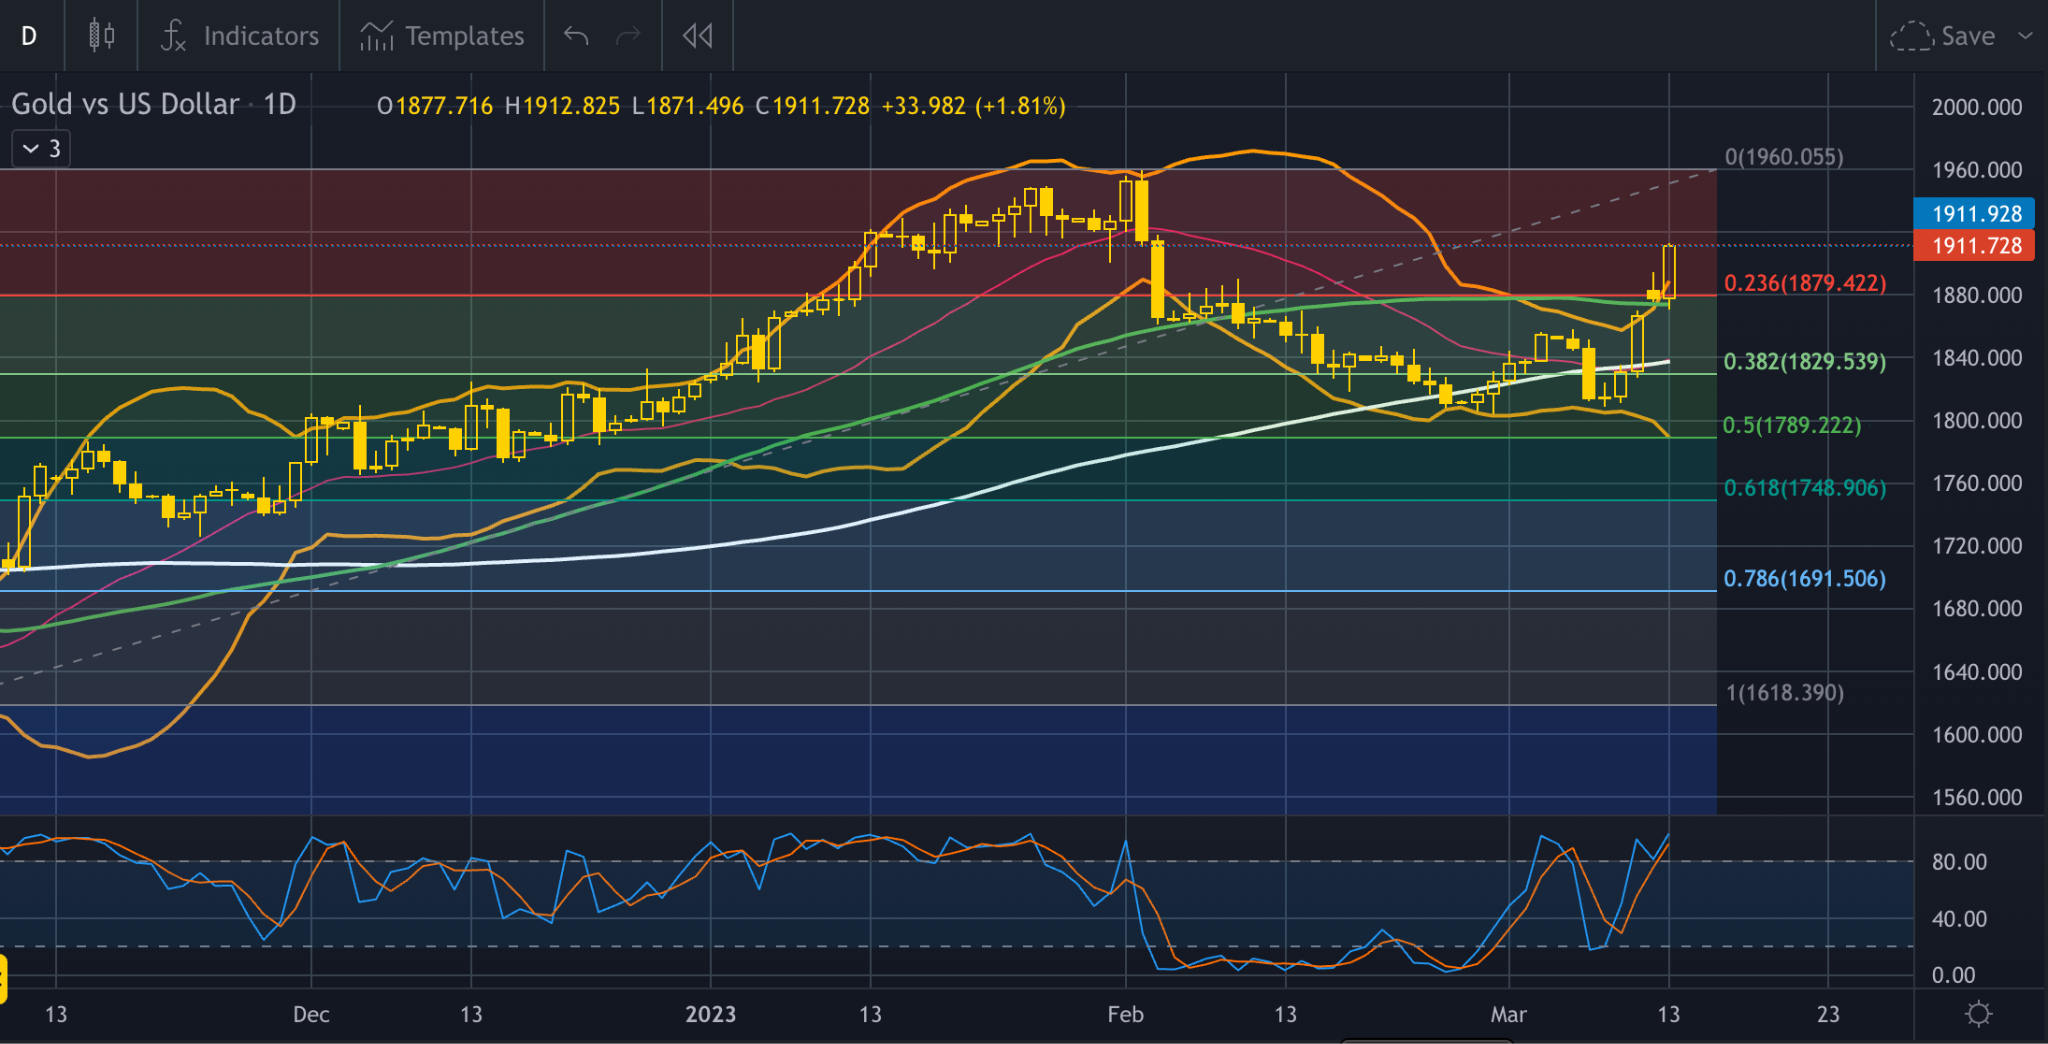
This preview of weekly data looks at USOIL and XAUUSD where Crude oil is approaching the end of a triangle formation on the daily chart and Gold is in an aggressive bullish momentum following the failure of three US banks.
The most important economic data for this week are:
- Claimant count change today at 07:00 AM GMT. Market consensus is for a further decline reaching -27 thousand claims compared to the latest release of -12.9 thousand. This could support the quid since less people are claiming unemployment allowances therefore the labor market looks healthy for the time being.
- UK unemployment rate today at 07:00 AM GMT. The figure is expected to slightly increase by 0.1% but since this data is for the month of January it might have already been priced in so no major effects might be seen on the British pound.
- US inflation rate today at 12:30 PM GMT. The expectations are for a further decline on the inflation figure of around 0.4% reaching 6% for the month of February. This is critical news for the Dollar since it would certainly influence the stance of the FED given the crisis with Silvergate and SVB failures.
- US PPI on Wednesday at 12:30 PM GMT. The consensus is for a decline of around 0.4%. Lower producer prices likely mean consumers will pay less at the retail level and possibly generate some short term gains for the Dollar.
- ECB interest rate decision set to be released on Thursday 16 March at 12:15 PM GMT. The scenario of a double hike (0.50%) seems to be the most possible in which case would support the Euro against its pairs. In the event of a single hike however then we might witness some minor losses on the currency at least in the short run.
- OPEC monthly report is set to be published on Tuesday where investors and traders would want to get some hints on the action plan of the organization in terms of production levels in the near future in an effort to determine the price of the black gold.
USOIL, daily
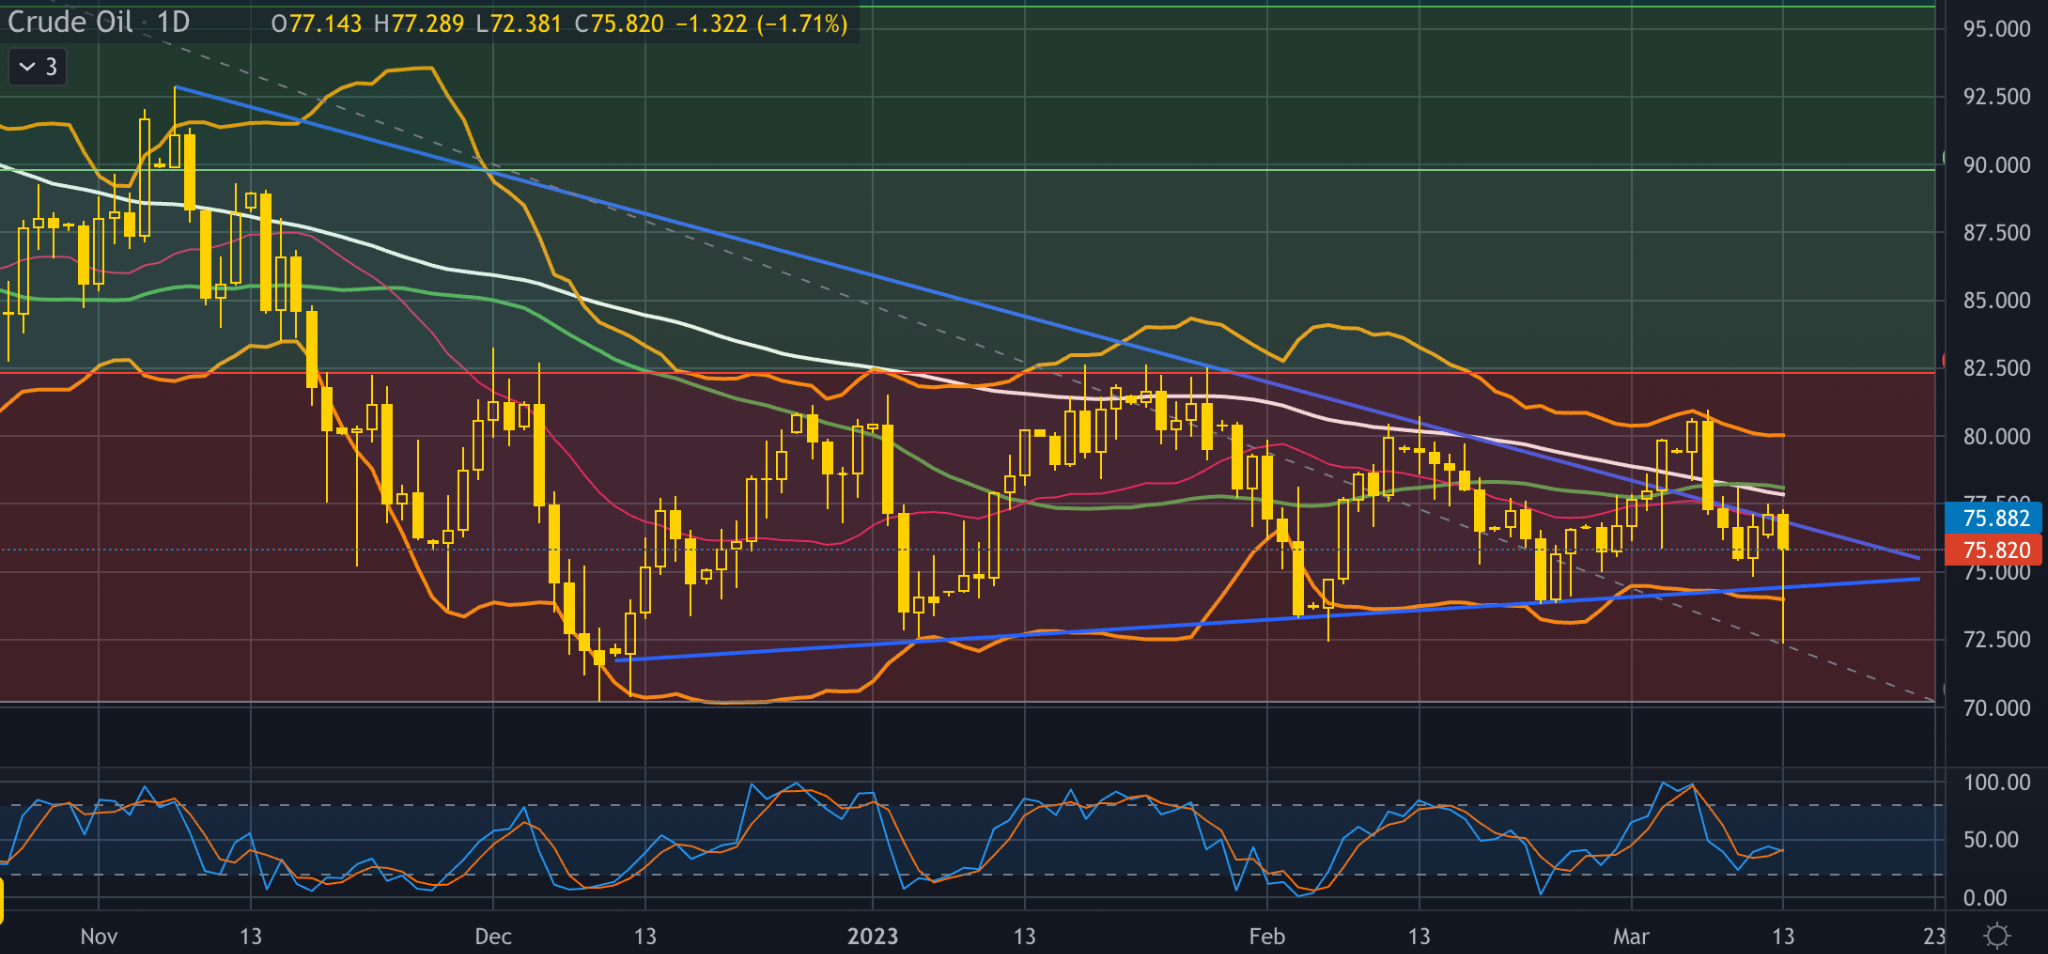
Crude oil prices took a hit on Monday the 13th as fears of a new financial crisis hit following the recent data of the Silicon Valley Bank(SVB) collapse. This is not the only bank that failed since Silvergate announced plans to wind down operations and voluntarily liquidate as well as state regulators closed New York-based Signature Bank(SBNY.O) on Sunday. U.S. authorities launched emergency measures on Sunday to shore up confidence in the banking system.
The price of crude oil was only supported slightly from recovery in Chinese demand for the commodity while important economic data coming from the USA this week will have an effect on the price in the following sessions since inflation rate and PPI are expected to increase volatility in the market.