It was a fun ride on the Bitcoin rollercoaster while it lasted. In one 4-week stretch, the world’s favorite cryptocurrency had risen from $5,300 to roughly $7,300 before volumes and momentum subsided. The Bulls were obviously out of breath, as the Bears stepped in to take over last Friday and push BTC below $7,000. A small comeback soon took shape, only to dissipate in the past 24-hour period. Bitcoin soon bounced off $6,600 and has now settled upon $6,800, as of this writing.
One has to return to four weeks in May of 2019 to witness the last time that Bitcoin printed a similar 4-week winning run. At that time, BTC leapt from $5,130 to $8,730 before the month concluded. Analysts now, however, are presently pondering the possible impacts of several foreboding signals that have appeared on their various charts, each one a bearish indication that more testing of lower limits may be in order in the short term. How low can Bitcoin go? Let’s start with a daily chart:
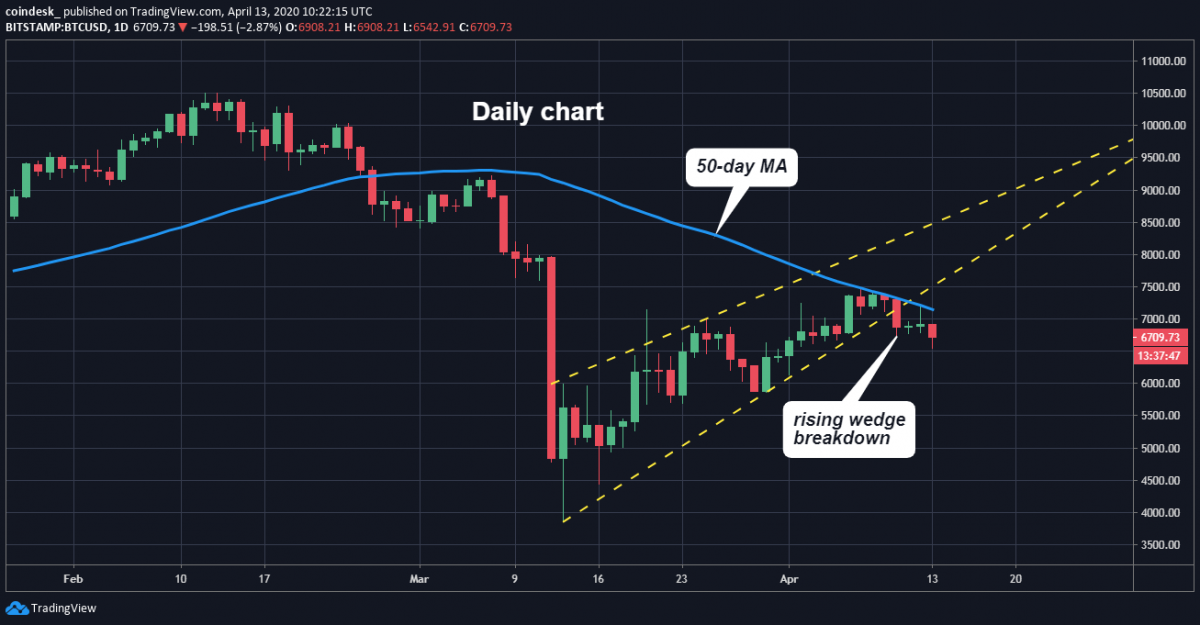
BTC/USD Daily Chart courtesy of CoinDesk
The first takeaway in the pricing behavior displayed above is that the 50-Day Moving Average is now providing formidable upward resistance, ever since its support broke down in late February. In order to recover to higher latitudes and realize the potential of halving valuations that have been touted for the past year, Bitcoin must forcefully drive through this resistance in a meaningful fashion.
The Ides of March had been cruel for crypto’s market leader and all other cryptos, as well, but a strong recovery had returned BTC to a place above its closing value for 2019. When the recovery failed this past Friday, the rising-wedge pattern, which had so nicely formed over a four-week period, also broke down. This breakdown, coupled with the overriding 50-Day MA resistance, presents a duo of obstacles in the path of Bitcoin.
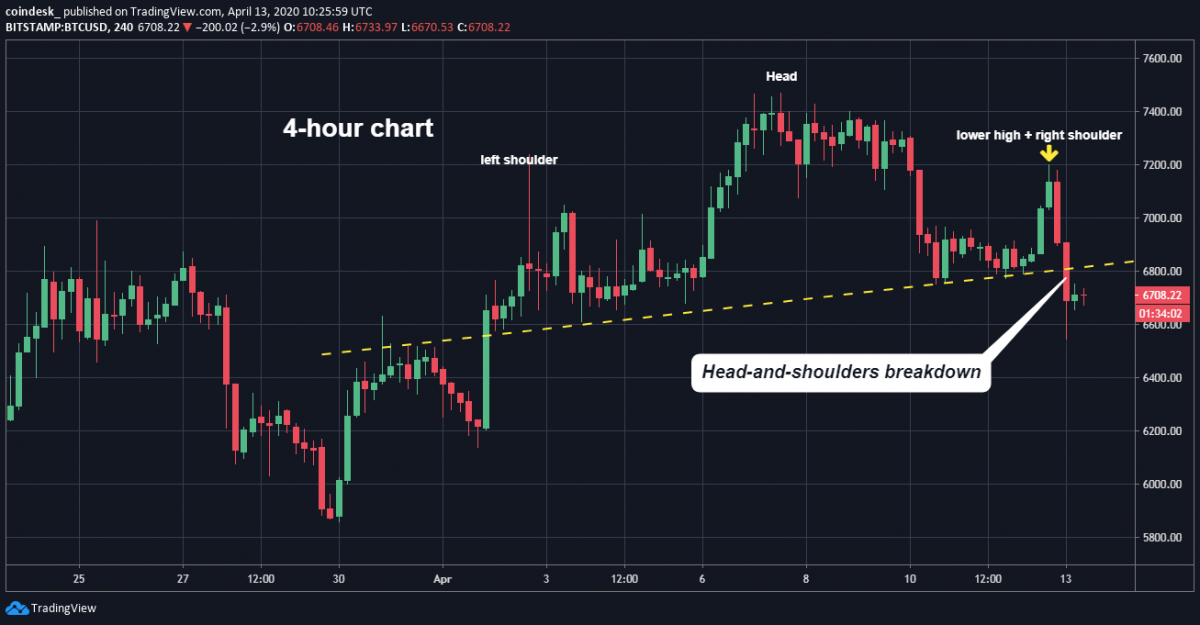
Unfortunately, the negative chart signals do not stop with this daily chart portrayal. The lesson learned over the last six weeks is that Bitcoin in a crisis moves in tandem with the S&P 500 index. Stimulus programs in the U.S. and elsewhere have recently buoyed equities to a degree, but, as quite a few analysts have warned, we may be due for a reality check once earnings reports begin their quarterly parade this week. This expectation of gloomy financial data may be what’s behind the formation of prominent “Head-and-Shoulders” patterns on shorter termed charts: