This article was submitted by Antreas Themistokleous, market analyst at Exness.
The trends from last week have generally continued the trends from previous weeks with some instruments trading well above their major trendlines and volatility playing a critical role in the days ahead. This preview of weekly data looks at GBPUSD and XAUUSD ahead of the critical releases of US and British monetary policies on 14th and 15th of December respectively.
The main event in last week was the US PPI rate (Producer Price Index) which came out to be an addition of 0.3% month over month indicating that the costs are rising in the US economy which eventually will be passed down to consumers increasing inflation in the future.
This week we have various publications coming up that can affect the markets like the US monetary policy on 14th of December at 7 PM GMT with market expectations looking at a double hike although the attention of the traders is focused on the press conference following the release where if the future plans by the FED are more hawkish it could support the buck where more dovish comments could create losses on the currency.
The British inflation report is set to be released on Wednesday December 14 at 7 AM GMT. After jumping to a 40 year high in October at 11.1% the expectation is a slight drop at around 10.9%. This might be somewhat positive news for the pound since this would influence a hawkish move by the Bank of England to proceed with a double hike on the 15th at 12 PM GMT.
Most markets will probably be quite volatile throughout the week since these publications will affect a number of instruments.
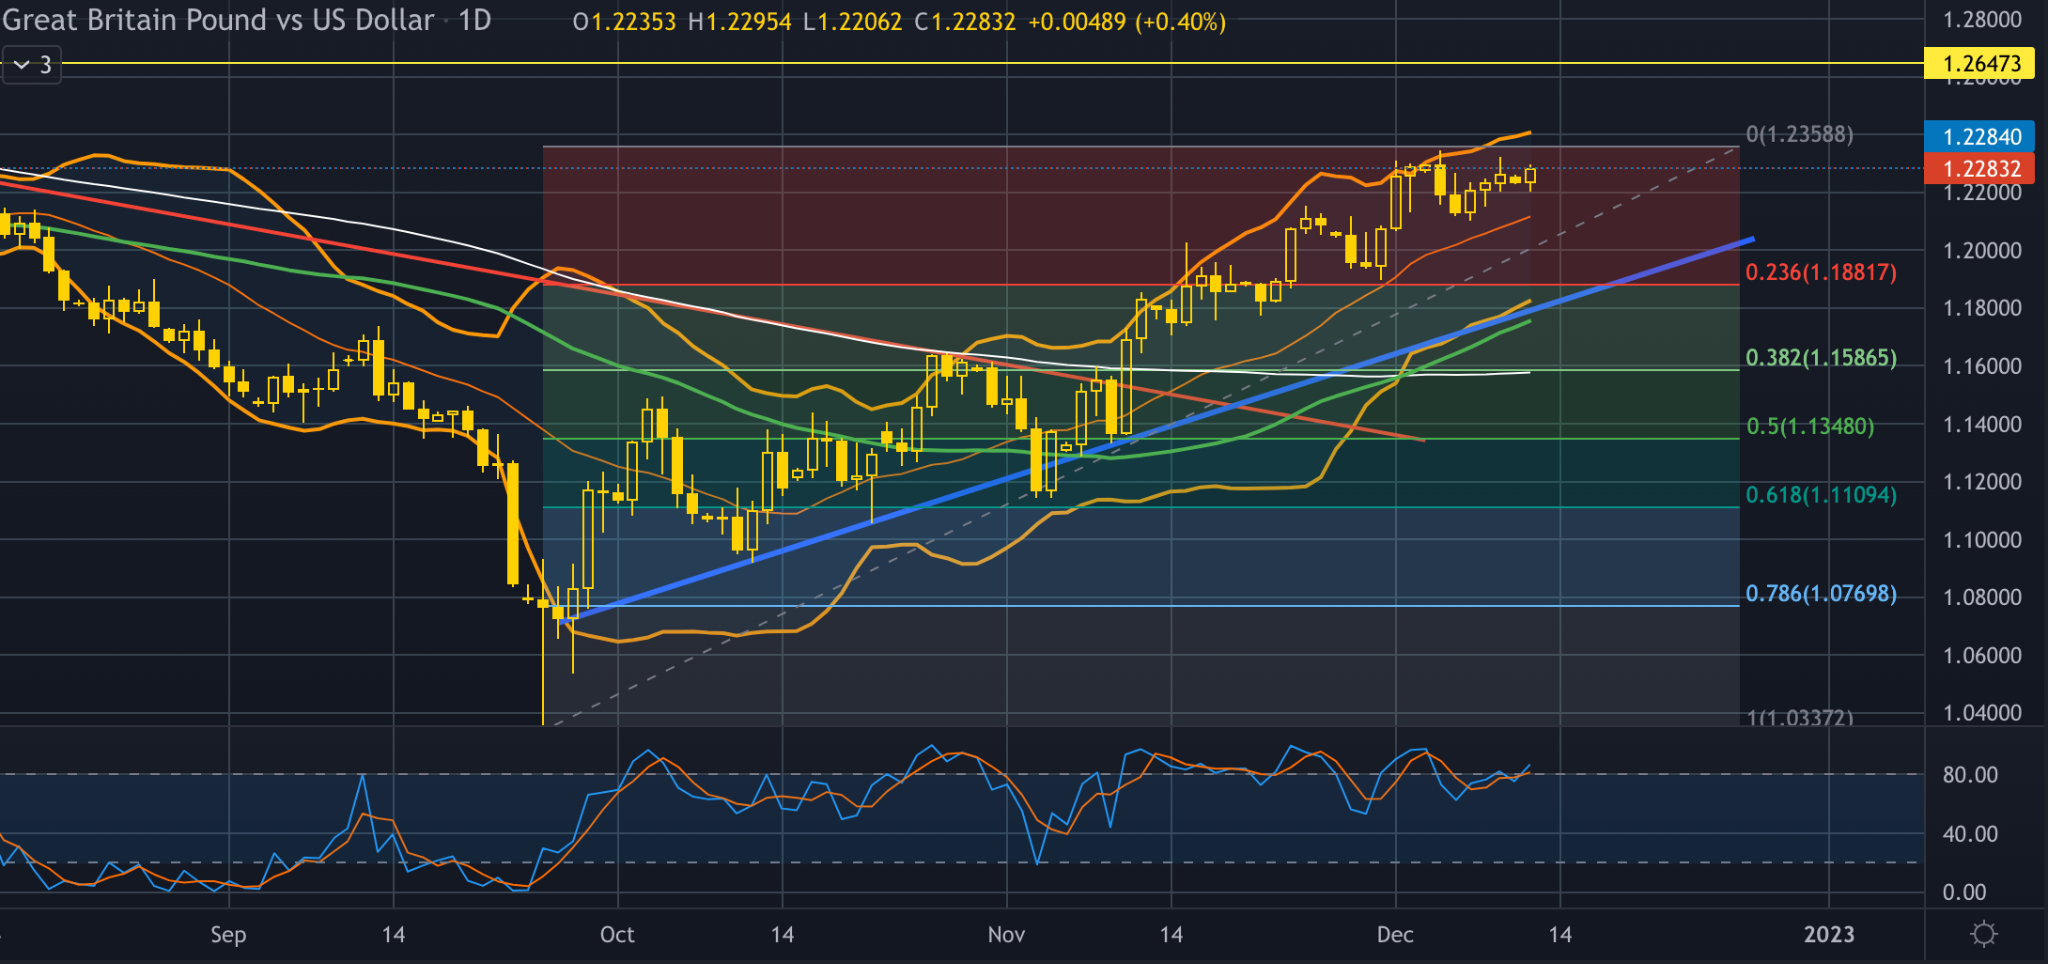
Cable, daily
Even though the monthly GDP in the UK rose in October and gave the quid some short term support, the impact of strikes in the UK’s rail sector and postal service threatening to disrupt business profits during the festive period, slowed down the bullish momentum. Further major losses were prevented throughout last week by market confidence of a 50 bps rate hike from the Bank of England (BoE) on Thursday.
On the technical analysis point of view the price is trading in a steady uptrend for the last month and it is currently at the $1.22800 area after finding resistance on the upper band of the Bollinger bands. With major economic news coming up and with the Stochastic indicator in the overbought level for almost a month, it is possible to see a correction to the downside before resuming the bullish movement. If this scenario is confirmed then we might see some support around the $1.18800 area which is just below the 23.6% of the daily Fibonacci retracement level, the lower band of the Bollinger bands and also a point on the daily bullish trendline.
If we witness a continuation to the upside after the publications we might expect some resistance around the $1.26470 area which is a strong inside resistance level since late May 2022. Any trading initiated is advised to take extreme caution and give priority to risk assessment and money management rules beforehand.
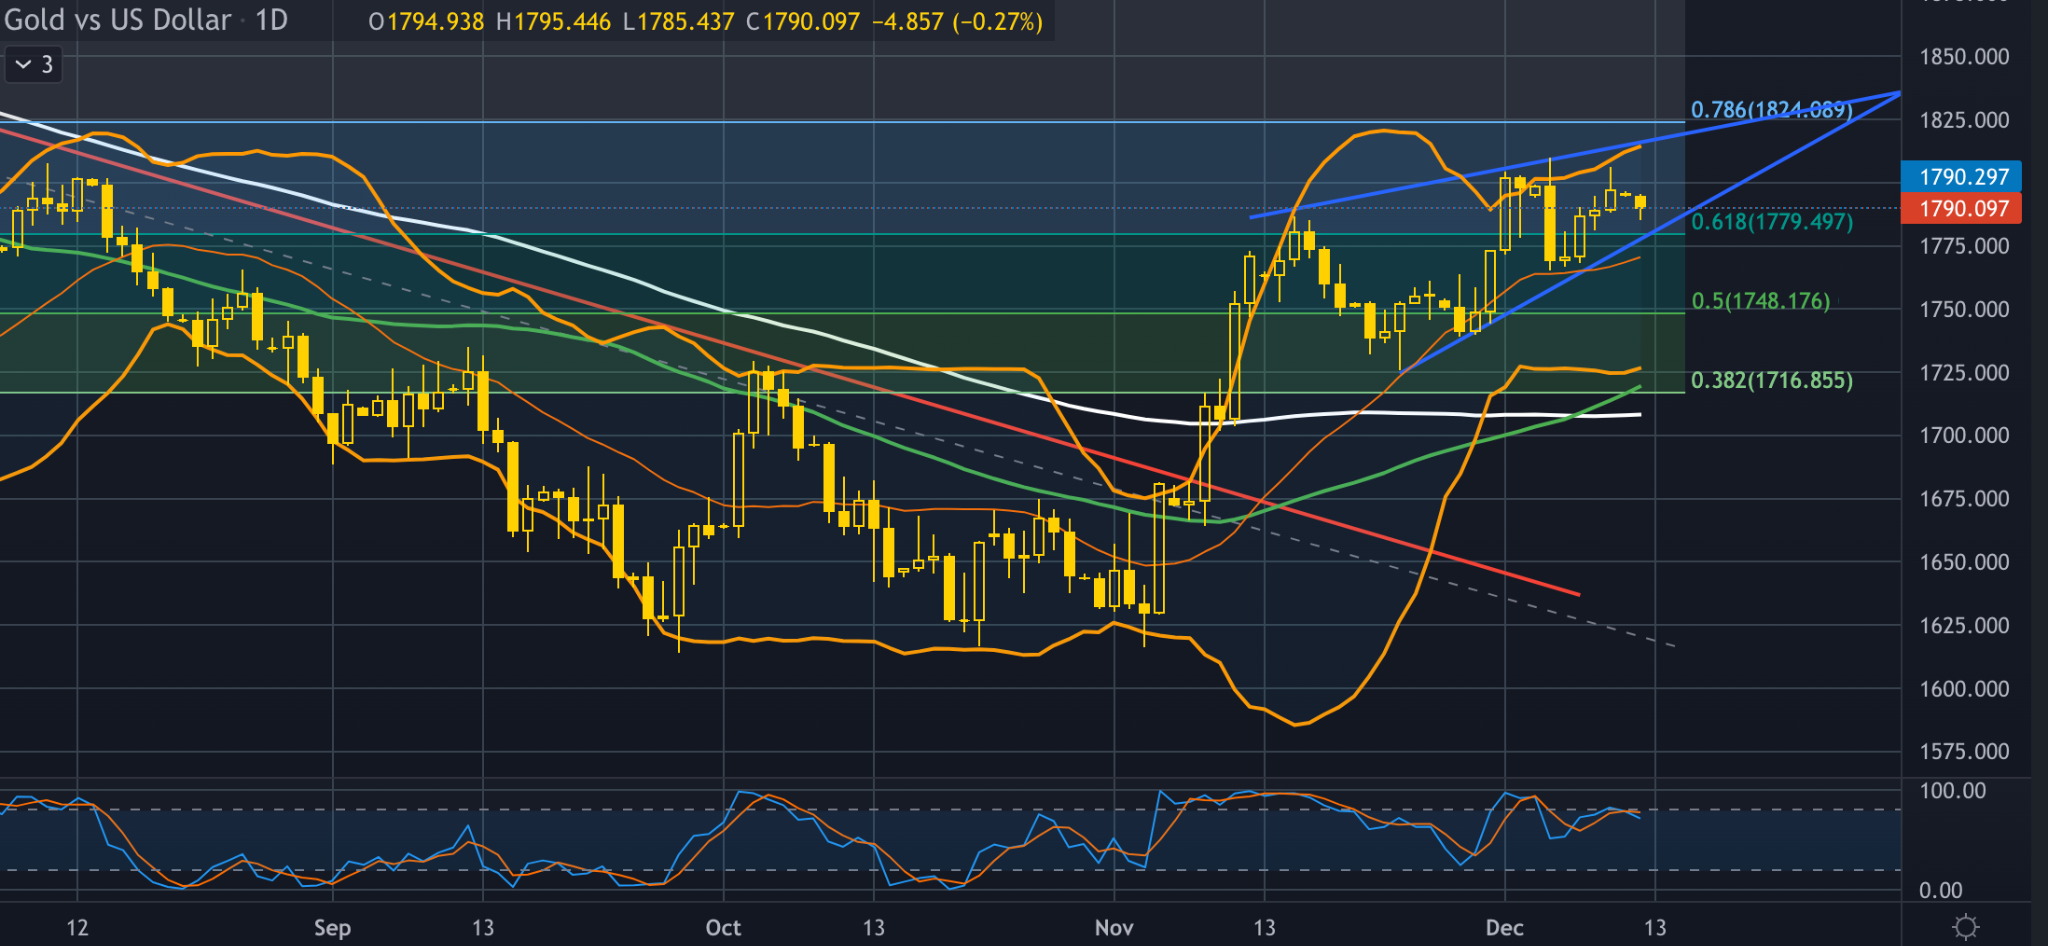
Gold-dollar, daily
Price of gold declined on Monday against a stronger US Dollar right before major economic news like the US key inflation data and the Federal Reserve policy meeting.The dollar index rose 0.3% making dollar-priced bullion more expensive for overseas buyers. Traders expect a double hike which if confirmed might increase the opportunity cost of holding gold as it yields no interest.
From the technical side the price of gold continued the bullish momentum with the price trading in a rising wedge formation. A rising wedge is usually a bearish signal as it indicates a possible reversal during an up-trend especially if there is a break below the lower side of the wedge. If this is the case then we can expect further movement to the downside with a first point of support around $1,748 level which is the 50% of the daily Fibonacci retracement level and the psychological support area of the round number.
Further continuation to the upside we can expect the price to continue trading within the “boundaries” of the wedge with a strong point of resistance being around the $1,824 area which consists of the 78.6% of the Fibonacci, the upper band of the Bollinger bands and also the upper level of the wedge formation.
Disclaimer: opinions are personal to the author and do not reflect the opinions of Exness or LeapRate.
Experienced writer and journalist, working in the global online trading sector, Steffy is the Editor of LeapRate. She has previous experience as a copywriter and has been with the company since January 2020. Steffy has a British and American Studies degree from St. Kliment Ochridski University in Sofia.