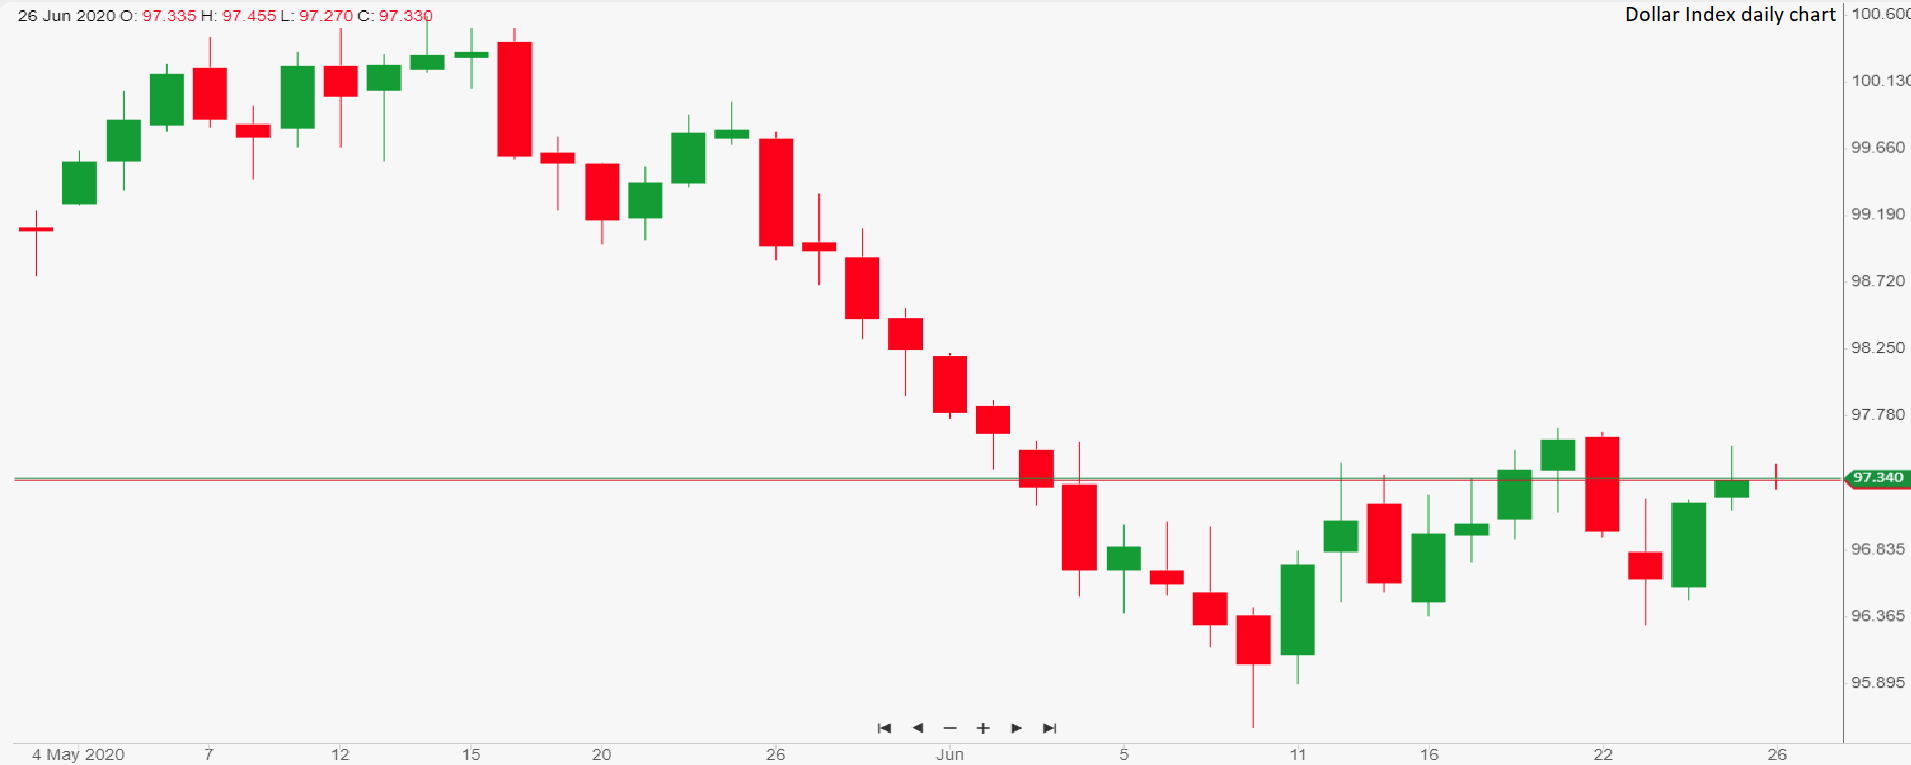
After two days of solid gains, the dollar index remains stable during early Friday trading. Fears that a virus resurgence could hinder the economic recovery have played in favour of safe havens, with the greenback one of the main beneficiaries. At the same time, many investors remain trustful that, as economies reopen for business, the stimulus action of governments and central banks will ignite a quick V-shaped recovery. There is therefore a degree of uncertainty that has characterised the markets this week, with an oscillation between confidence and fear driving investors’ risk appetite.
USD index chart
Ricardo Evangelista – Senior Analyst, ActivTrades
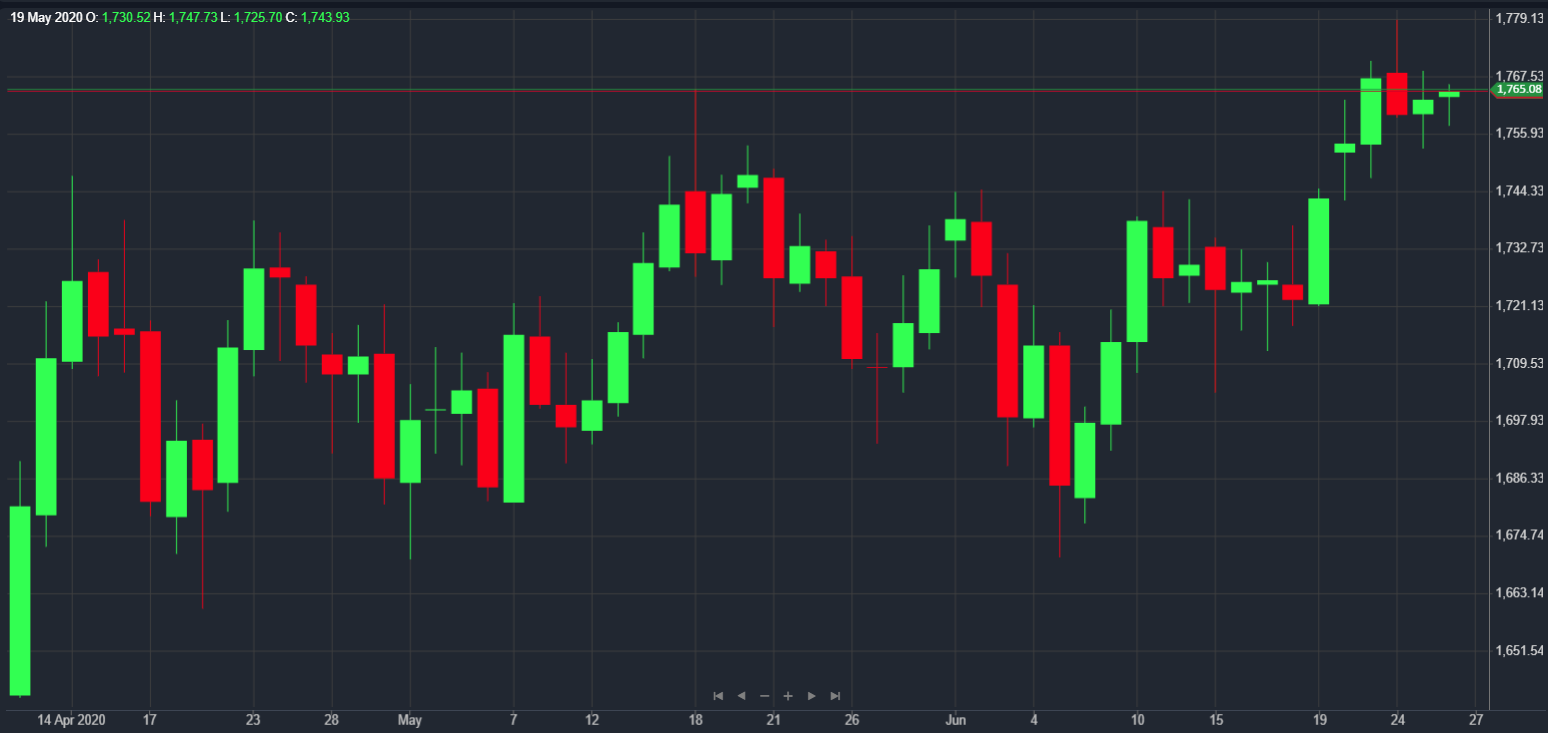
GOLD
Gold spot price is steady above $1,760, having achieved a 7½-year high. Despite the recovery of the dollar seen in the last 48 hours, the price is resilient to decline, confirming a significant investor interest for the yellow metal. Technically the main scenario still appears positive, and we could be in a consolidation phase, with the market trying to gain strength for potential further rallies, which will have more chance of success if stocks decline and risk-off mode comes back.
Carlo Alberto De Casa – Chief analyst, ActivTrades
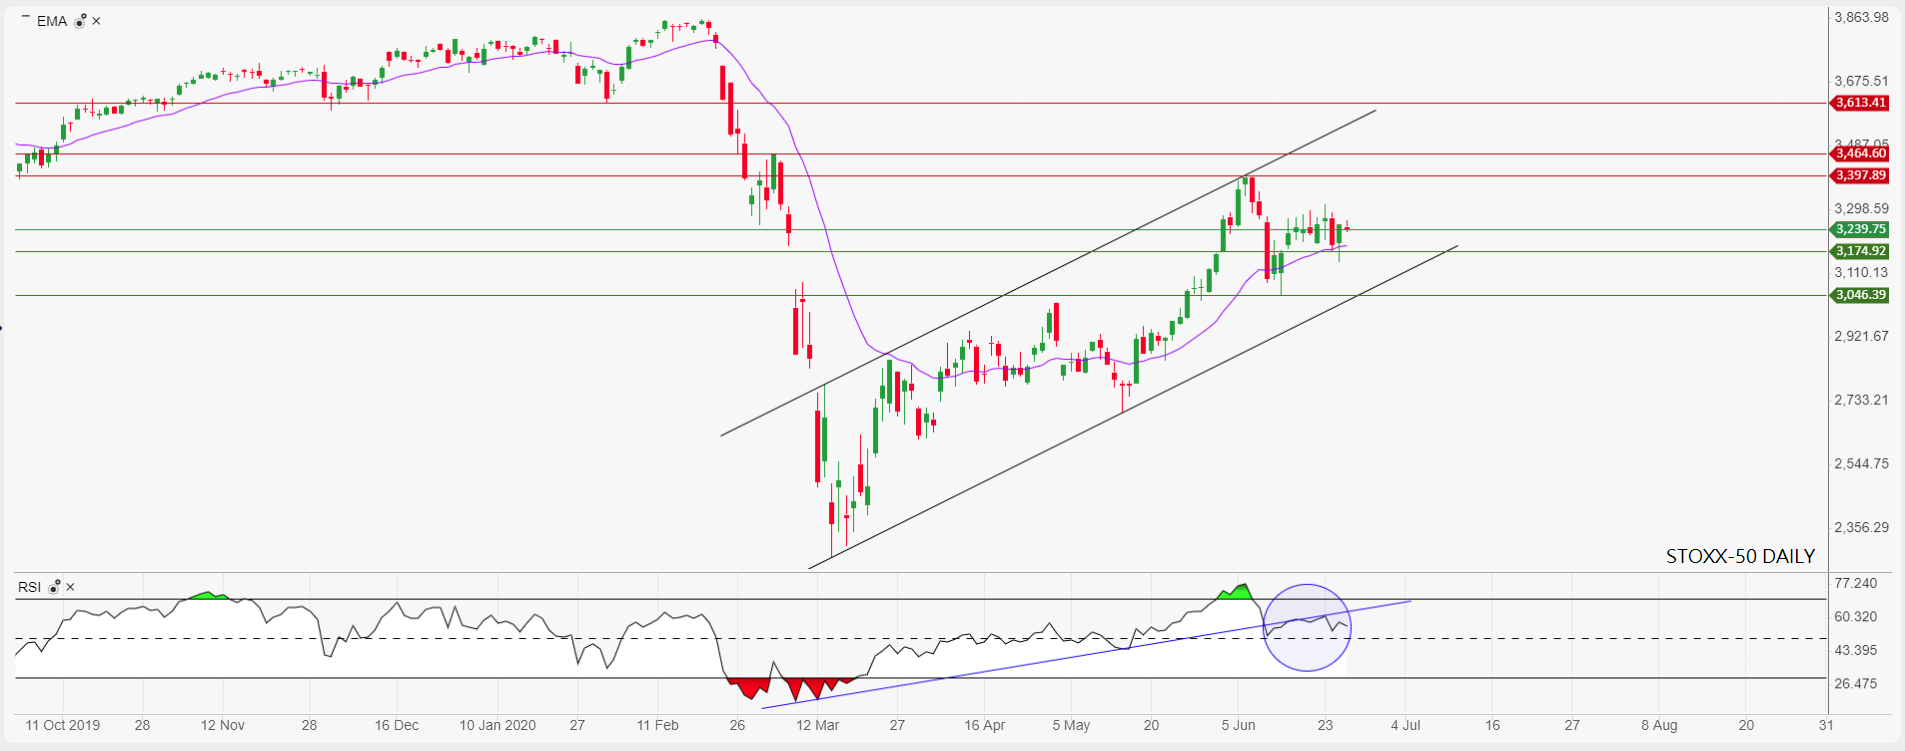
European shares opened without clear direction on Friday as market sentiment remains mixed for the end of the week. Despite a strong optimistic tone registered in June, investors’ risk appetite is now tempered by a renewed momentum in daily virus cases in many areas, as well as rising trade tensions between Washington and the EU.
While traders don’t expect any significant macro data today, volatile and sharp price action may still take place in the afternoon as investors could be tempted to reduce their exposure to riskier assets ahead of the weekend. The technical configuration in Europe isn’t too worrying but does not encourage traders to go long on the short- to mid-term view.
The Stoxx-50 index is trading in the middle of its bullish channel, slowly flirting with the 3,250 pts zone. The presence of multiple doji candles in this zone combined with an RS Indicator showing a trend break-out slightly above the 50% zone, means the market loses momentum and remains hesitant to register higher levels, increasing the likelihood of a correction.