
What a difference a week makes, or does not make in the case of Bitcoin’s progress toward a new All-Time-High (ATH). Based on favorable news about the launch of the Bakkt exchange in late September, BTC buyers were numerous at the start of the week, driving prices up to strong resistance at $11,000, only to pull back to firm support at the $10,000 level. As the weekend approaches, momentum appears to be building from a technical perspective. Rallies have often begun during weekend trading during 2019.
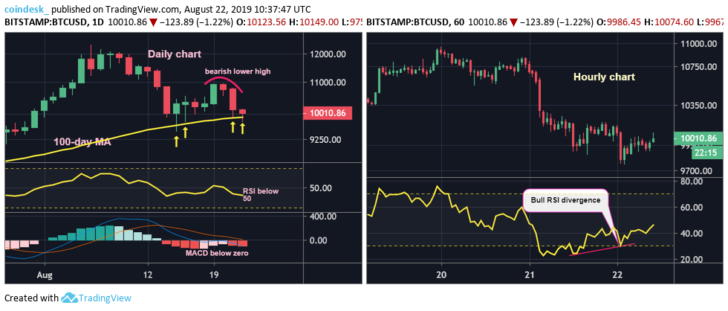
According to the above combo-chart, courtesy of Omkar Godbole at Coindesk, Bitcoin has been buoyed by the strength of its 100-day Moving Average on the daily portion of the above depiction. If you slide to the right and take a look at the hourly version, the Relative Strength Index (RSI) indicator has bounced off an oversold condition and is displaying a Bull divergence, as noted on the chart, both good signs that the weekend to come could yield positive developments.
The “Double-Bottom” in the daily display also looks promising, as well. Its “neckline” rests at $11,000, thereby suggesting that a potential target could be in the $12,000 realm. The MACD Histogram has yet to reverse, something that traders will keep an eye on for the next few daily periods. As we have noted in the past, however, Bitcoin has a history of ignoring traditional technical prerogatives and moving to the beat of its own internal drivers that remain a mystery at this juncture in its evolution.
Could a negative corrective move be in the making? There is a “hint” on the hourly chart that is of concern. The formidable support at $10,000 was tested twice in the span of just 20 hours, which created an interesting short-term wedge pattern. Prices on the chart rest at the upper boundary, a crossroad, so to speak. If it breaks through, the “test” is over, and BTC could move higher at will. If the move is down, however, then the lower values in the upper $9,000’s come into play. The 100-day MA on the daily chart could also influence market price action, thus providing for an interesting storyline over this coming weekend.
Is there a prevailing narrative in the analyst community about potential near-term Bitcoin movements? As we recently reported, investor sentiment has declined precipitously of late. The Fear and Greed Index hit its lowest level, “11”, since last December. John Todaro, director of digital currency research for TradeBlock told Forbes:
Sentiment has drifted lower as a sustained push higher has been halted, while alt-coin sentiment has been low for several weeks now as alt prices continue to decline.
Conversely, a few analysts do see positive prospects in the tealeaves. According to Godbole at Coindesk:
If prices close above $10,000 today and end up rising above $10,927 (Aug. 16 close) in the next day or two, then a double-bottom bullish breakout would be confirmed. That would open the doors to $11,850. BTC has failed at least four times in the last eight weeks to close (Sunday, UTC) above $12,000. So, a weekly close above that level is needed to confirm a complete bullish revival.