This article was submitted by Antreas Themistokleous, market analyst at Exness.
This preview of weekly data looks at EURUSD and XAUUSD, where economic data coming up later this week are the main drivers in the markets for the near short term outlook.
The most important economic data for this week is:
Wednesday:
Chinese manufacturing PMI expected to slightly increase to 49.8 but still remain below the 50 level
Quarterly GDP growth rate to rise by 0.5% for the first quarter
US job openings for April with market consensus at 9.2M against a previous 9.59M
Thursday:
Flash EU Inflation rate expected to drop at 6.3% and unemployment to remain stable at 6.5%
US manufacturing PMI for May has a consensus of 47 points
Friday:
US NFP has a market consensus of a decline by around 73K reaching 180K even though it is still positive.
US Unemployment rate is expected to slightly increase to 3.5% against the previous all time low of 3.4%.
The first week of every month is historically more packed with economic data and this week is no exception. Main focus of investors and traders is on the US job report on Friday but there are other important releases throughout the week that are expected to spark volatility on the majority of the pairs across all markets.
This will likely be a rather volatile week for the pair since there is major data related to EUR and USD in 3 consecutive days this week with the peak on Friday where the “king” of publications the NFP is set to be released.
FOMC minutes last week confirmed that the main objective of the FED is still to curtail inflation which is still above the target rate of 2%. Job market remains strong still and unemployment remained low while participants noted that: “ in light of the lagged effects of cumulative tightening in monetary policy and the potential effects on the economy of a further tightening in credit conditions, the extent to which additional increases in the target range may be appropriate after this meeting had become less certain.”
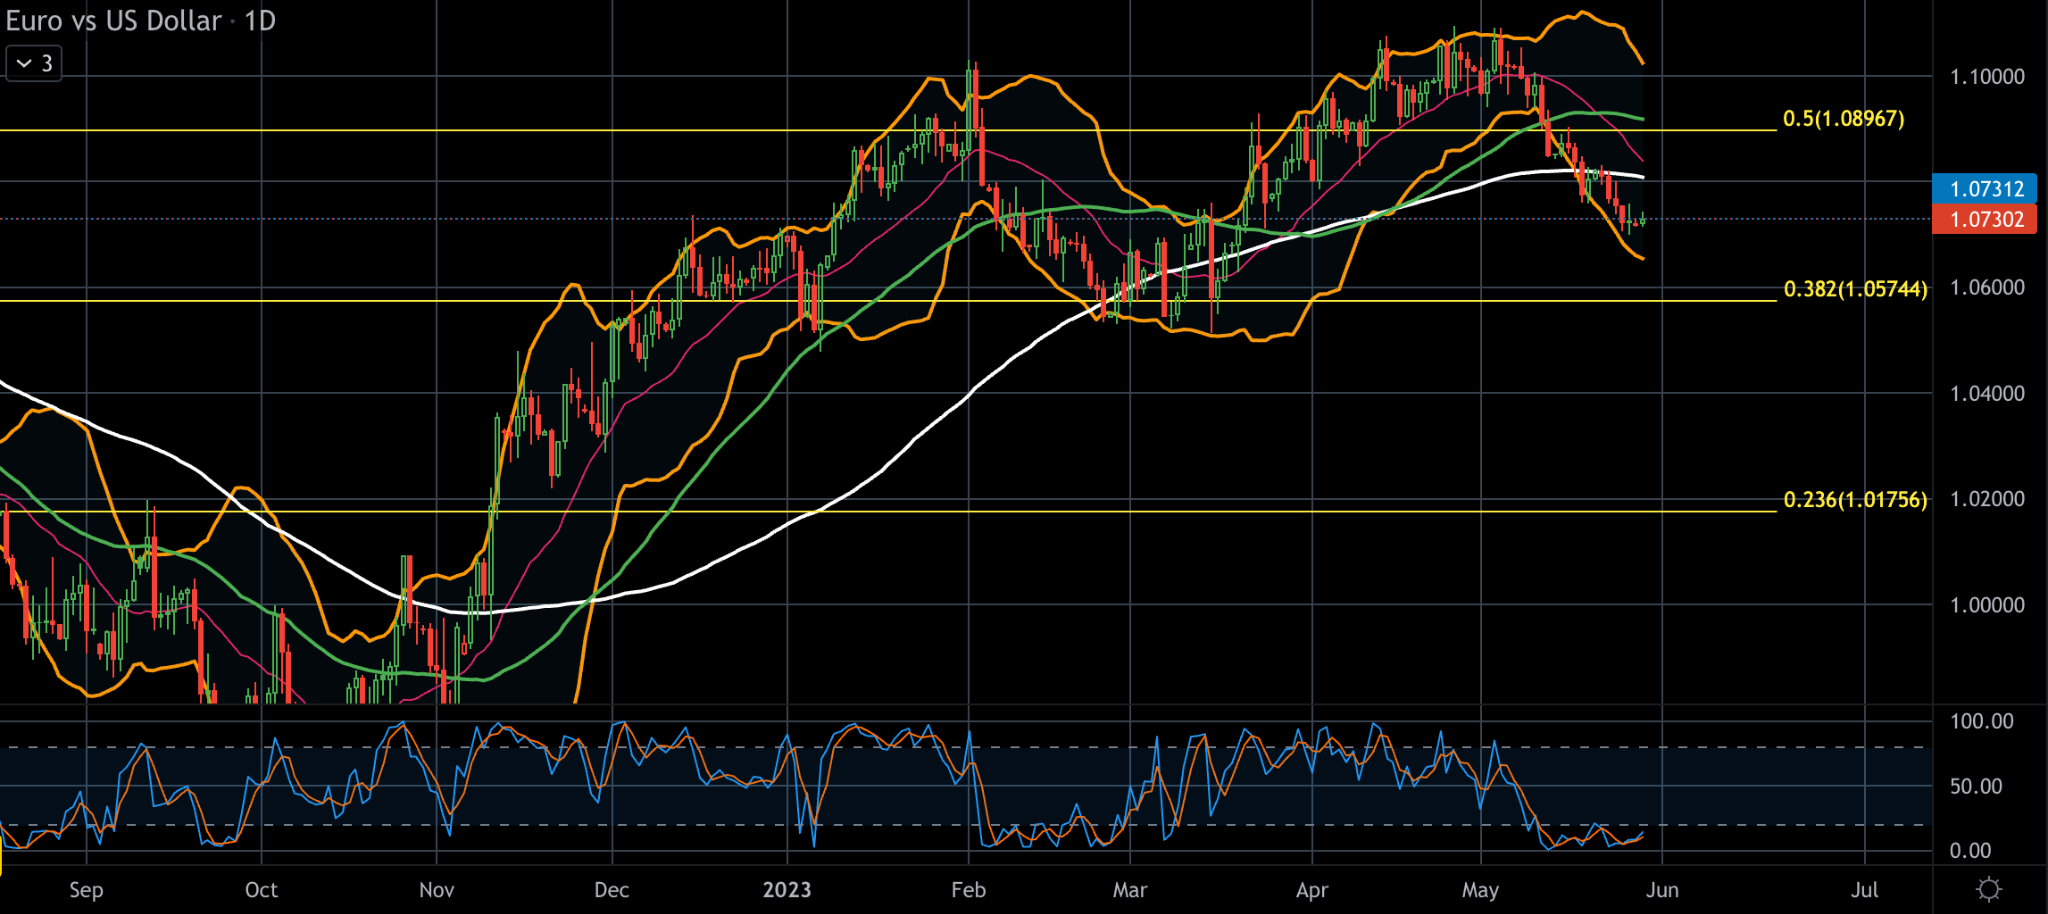
On the technical side, the price on the chart has found resistance on the upper band of the Bollinger bands in early May and has since corrected to the downside. The 50 SMA is still trading well above the 100 SMA, indicating the overall bull movement is still strong, while the Stochastic oscillator is near its extreme oversold level possibly indicating that a bounce to the upside might be possible in the coming sessions.
All in all the area of $1.08 consists of a strong technical resistance area since it consists of an area on the chart where the 20 & 100 day moving averages almost touch and is also the psychological resistance of the round number. On the contrary the level of $1.06 is considered a great support area on the price because its made up of the 38.2% of the daily Fibonacci retracement and is also an area of reaction to the price in late February and mid March.
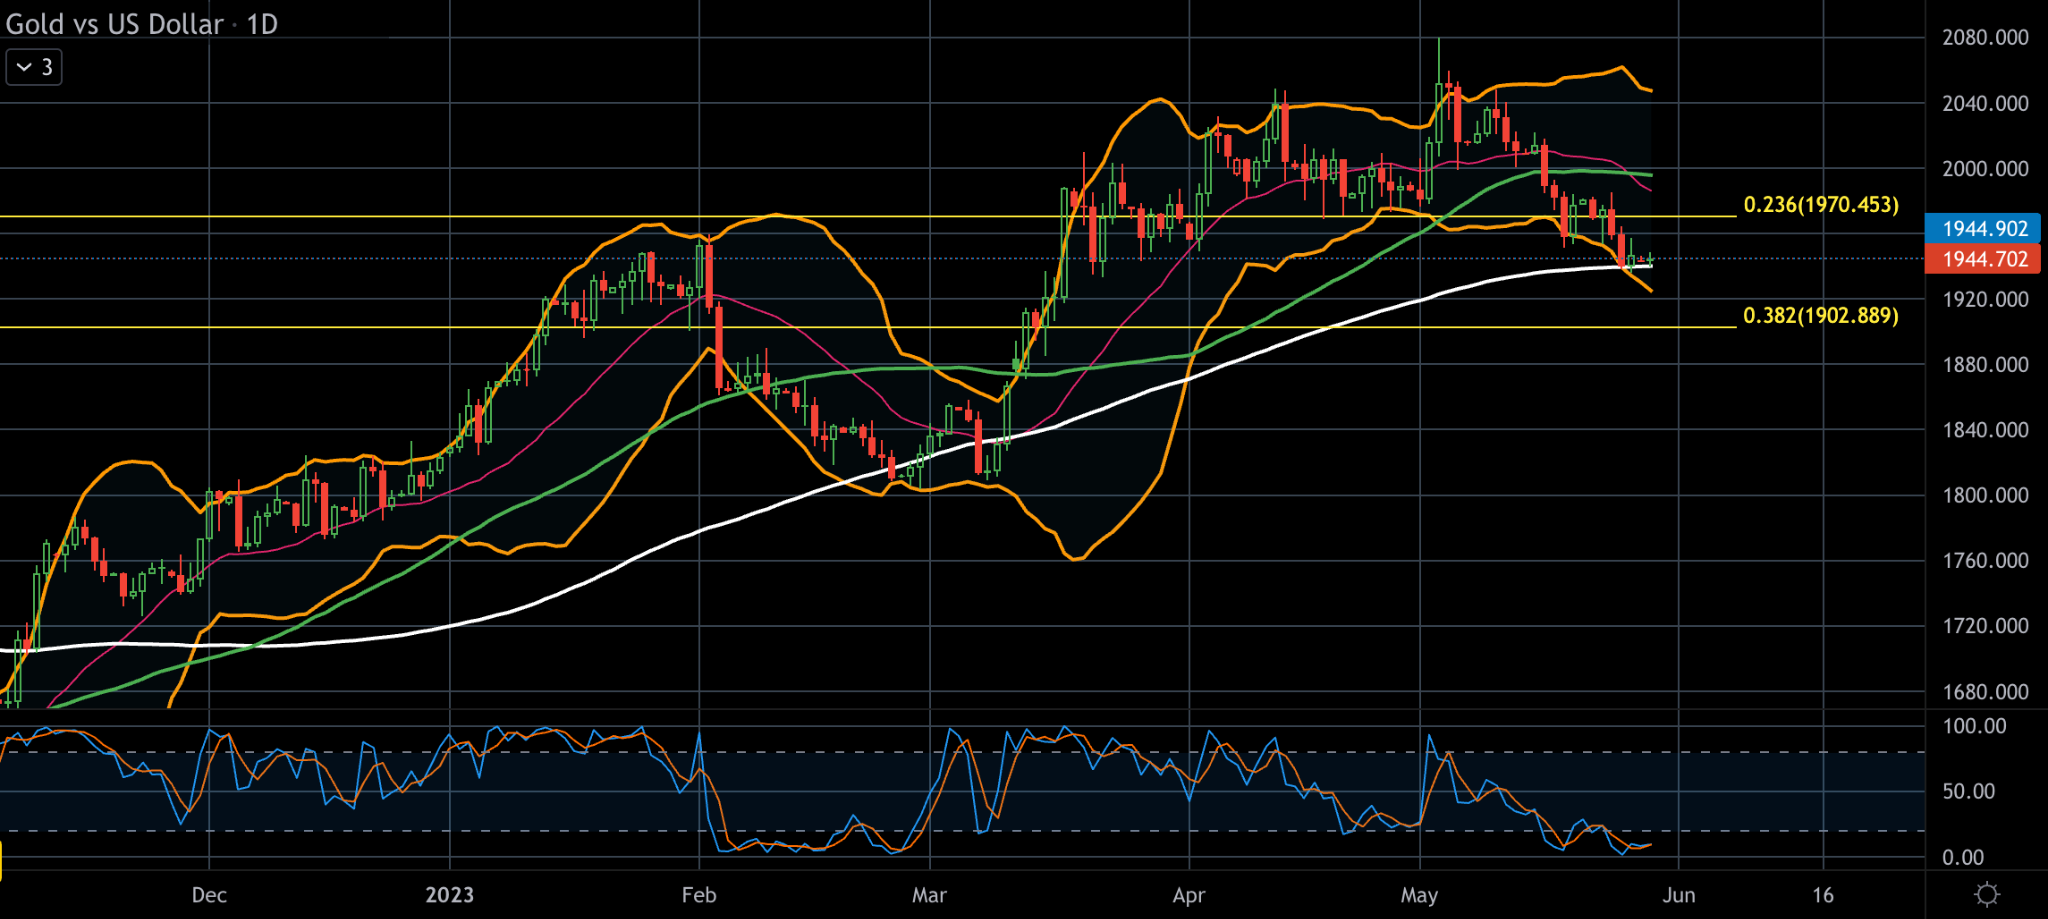
XAUUSD , daily
The price of gold edged down in thin trading on Monday as progress is seen regarding the U.S. debt ceiling agreement and weighed on safer assets, while chances of the Federal Reserve raising rates higher reduced the demand for the yellow metal. According to the CME fedwatch tool the possibility of further interest rate hike has exceeded the narrative of pausing in the last week, reaching more than 65% in favor of the hike.
The pull-back in gold came as stocks rallied on the news of a debt deal being finalized in Washington, although trading ran on thinner volume with parts of Europe, Britain and the U.S on holiday.
From a technical standpoint, the price is in an overall bearish movement for the last month with a minor correction happening in early May. The 50 day moving average is trading above the 100 day moving average indicating that the overall bullish momentum is still valid despite the prolonged correction in the last month.
The Stochastic oscillator is recording extreme oversold levels further supporting the narrative of a bounce back to the bullish movement. Currently the price is trading exactly on the 100 day moving average , at the time of this report, and is crucial to monitor where the next sessions head to get an estimate of the short term trend forming.
Disclaimer: opinions are personal to the author and do not reflect the opinions of Exness or LeapRate.
Experienced writer and journalist, working in the global online trading sector, Steffy is the Editor of LeapRate. She has previous experience as a copywriter and has been with the company since January 2020. Steffy has a British and American Studies degree from St. Kliment Ochridski University in Sofia.