This article was written by Stanislav Bernukhov, Senior Trading Content Specialist
The beginning of October in the financial markets was relatively quiet despite the expected volatility growth. The NFP release was delayed due to the government shutdown in the US, so volatility was muted across the board, as the only important economic driver published was US services PMI, which was slightly lower than forecasted (50 instead of 51), but still indicating a positive development.
Despite the absence of official data from the US labor market, investors maintain a mildly positive sentiment as private sector indicators show rather a consolidation of hiring and new payrolls, than their growth or decline. That hasn’t boosted volatility, and markets in general kept the momentum, with S&P 500 closing the week in green. Bitcoin has rallied and established a new all-time high at around $125000, while Crude oil has slided down to almost $60.
The new decision of OPEC+ on Sunday, Oct 5th, was to modestly increase the production, which might be considered as a soft outcome for Crude oil, as one of the options was to increase it twice from the current level. That is still a bearish factor, along with the latest development about Hamas-Israeli talks in Egypt.
The general warning from the US president Donald Trump to Hamas made the markets wobble, with Nasdaq closing the day in red, and VIX having grown to above 16, which is still quite far from any real volatility. Crude oil futures stayed in a bearish direction despite all concerning factors.
Traders will look forward to the end of the government shutdown this week and the news from Israeli-Hamas talks.
Among important economic publications, traders will look forward to the FOMC minutes publication on Wednesday and Michigan consumer sentiment index on Friday.
Now, let’s go through basic scenarios for Crude oil and S&P500 index for the upcoming week.
USOIL
Crude oil moves down accelerating the momentum near the bottom of the 20-day Bollinger Bands. The next possible support would be located around the $59-60 area, as the breakout of the $60 area may trigger some short selling and liquidations of leveraged long positions.
As the market enters the highly volatile seasonal period, we might observe wide swings in both directions after completion of the mentioned target.
USOIL, daily chart : Source, Exness.com
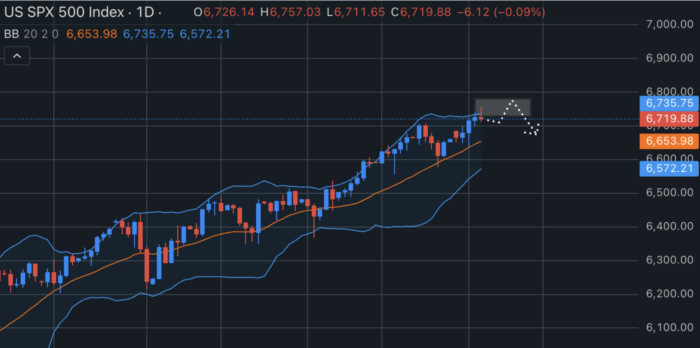
S&P500
The S&P500 index is positioned above the upper line of the Bollinger Bands (20) indicator, showing weakening momentum. Market breadth is slowly decreasing, as the tech sector has got under pressure on Friday. That might be a normal sector rotation mechanism within a bullish market, or a precursor of a wider correction.
Anyways, the bullish trend might persist, but upside breakouts might be vulnerable to profit taking and corrections as the upside rally reaches the plateau.