ATFX Global Chief Market Strategist, Alejandro Zambrano, prepared a market analysis of the next FOMC rate meeting.
The next FOMC rate meeting will take place next week on December 11, 2019, and looks to be an event that should not spur too much attention in the markets as the Federal Reserve has made it clear that they will not budge on rates for months.
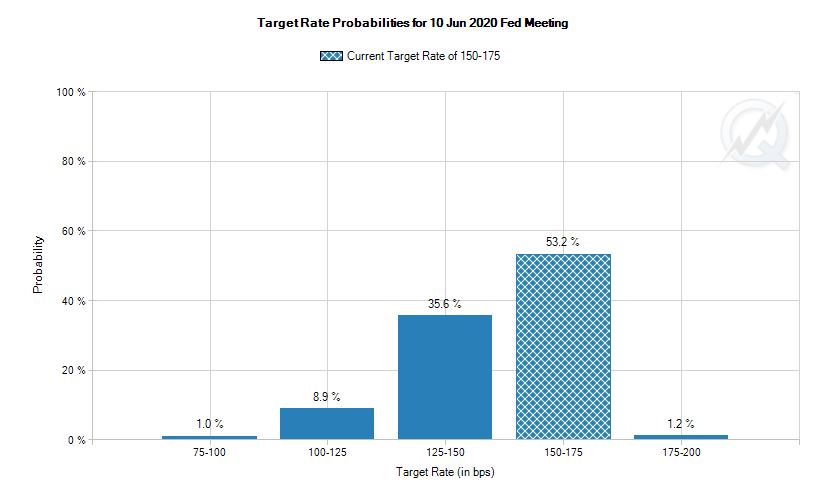
CME Fed Watch Tool
According to the CME Fed Watch tool, interest rates traders are pricing in that rates will remain unchanged at the current interval of 150-175 with a 98.8% probability. It is first in June 2020 that we start to see the market price in a different scenario. At the June 10, 2020 rate meeting, the markets are giving it a 45.6% probability that the US interest rates would be lowered by 25 basis points.
There are, however, some items that might change the outlook for the next week’s Federal Reserve rate meeting. First, it will be interesting to find out what the central bank thinks about the latest weak readings in the US ISM indicators. At the rate meeting they will also be in a position to have a view on the most recent US job market creation.
I think the Federal reserve will not rock the boat, and instead wait for the next few months to see if the effect of their rate cuts is felt in the economy, and it should be positive as stock markets are currently predicting with their sharp price rise in the last few months. I even think the stock markets might be a bit too optimistic, and there is a risk for short-term disappointment, as we have seen recently on the soft ISM indicator readings.
Implications for the S&P 500
The implications of next week’s FOMC rate meeting for the Dollar and stock markets should be muted, but any overreactions by the markets are interesting.
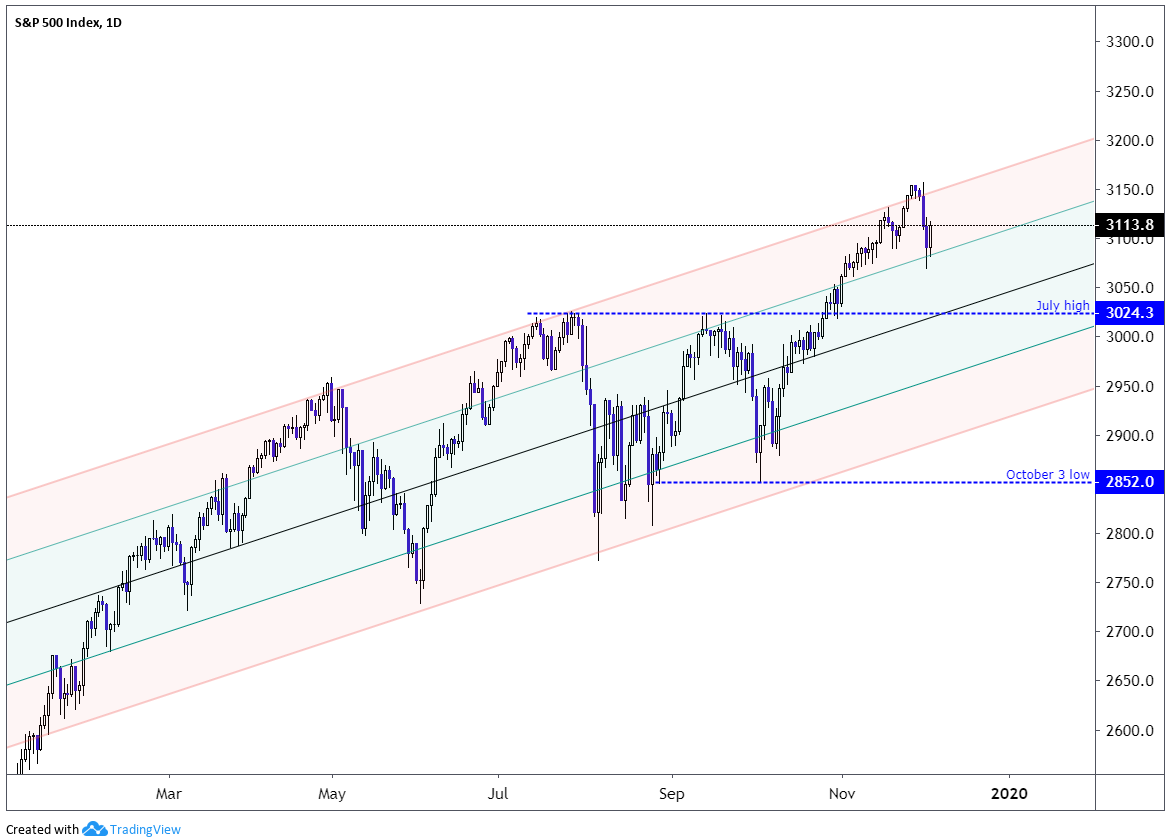
The S&P 500 is in a clear uptrend for a few months and stands to gain following a more significant price correction, something that might be triggered by next week’s rate meeting. There are a few levels I would watch.
First, the long-term trend in the S&P 500 will remain upwards above the October 3 low at 2851.1, and corrections that do not extend below this low will probably be bought by investors.
The first level that interests me is the June high at 3024.3, this level acted as resistance and will and could trigger buyers to step in. Around the June high at 3024 we also find the median-line of the channel seen in my chart below. This channel has done a good job explaining the price action in the S&P 500 in the last few months, and it is suggesting that the price is close to the upper red-trendline, therefore, the S&P 500 is overbought. It is also suggesting that investors might consider buying at the 2960 level, the lower green trendline, followed by the lower red trendline at 2890, if the first few levels do not hold.
S&P 500 Index Chart