
The following article was written by the team of https://www.bestonlineforexbroker.com.
Dear traders,
Have you ever felt puzzled seeing price action drastically change its course all of a sudden?
This is of course a frustrating process for everyone but there is a silver lining even when this happens. Having a clear view of how the market works has undoubtedly boosted my understanding of how to read price graphs and choose good entry zones.
The article touches upon an easy 3-step guide on how to work with and analyze the market structure of Forex, CFD, and commodity price charts.
Support and Resistance:
Deciding on Key Decision Making Zones
To understand the market structure it is important that you mark key Support and Resistance on the graph. At S&R zones the price can respect, stop, or move back which takes place when:
- There is intersection of levels at this zone or close to it.
- The price is coming up to a relevant (respected) and recent S&R level first or second time.
Traders should know these main price zones and avoid trading into key levels. Moreover, they can consider trading away from those levels.
Which key R&S levels you use may vary from trader to trader. But remember that it may clutter the graph if you add too many S&R levels.
Here are some examples:
1. Pivot Points
2. Round psychological levels, such as 1.10 or 1.25;
3. Bands like Bollinger Bands;
4. Fibonacci retracements
5. Other S&R levels like Fractals and moving averages.
Up and Downtrend: how to define the Direction of the Price
The trend shows the overall direction of the graph and it shows whether the price is rising or falling.
The graph is trending when the price is rising or falling. In case the price is moving sideways, it is called a non-trending graph or chart.
Trend is of vital importance to read the graph for it gives the opportunity to define which direction of the price is stronger. The trend goes on until there are a visible reversal patterns.
The trend is best represented by trend channels and a long-term moving average (MA), e.g. Fibonacci Mas like 89 and 144 ema.
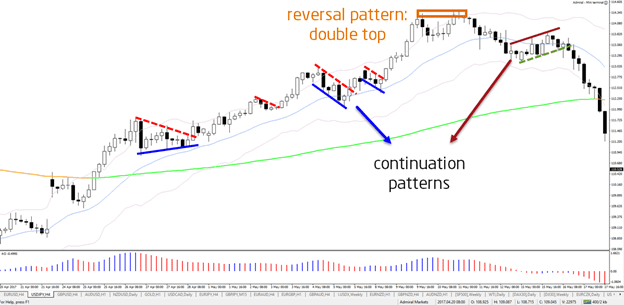
Price patterns. Market Psychology
So what is a price pattern? A price pattern is a repetitive price movement. , it gives information concerning potential reversals, corrections of the trend, continuations of the trend, ranges etc.
For example, a bull flag chart pattern shows that there is a higher chance that price will go on with the trend, This is especially valid if the price breaks flag resistance with strong candlesticks.
Traders can find and use a big number of discovered and undiscovered patterns. However, you should bear in mind patterns that lack internal logic. For instance, if your favorite football or basketball team won a match the day before it does not mean you should expect a bullish day on the GBP/USD as it is likely to be a random pattern.
Look at some tested patterns:
1. Chart patterns;
2. Divergence patterns;
3. Break, pullback and continuation patterns;
4. Candlestick patterns;
5. Wave patterns.
Choosing the Path of Least Resistance. Utilizing the Market Structure
You should know that the price usually chooses the path of least resistance and consequently it flows from one level to another. At each point, the price may go on with its momentum or respect the support level or the resistance level. Thus there are two options:
- if the momentum is stronger the price will break through the support or resistance level;
- if the momentum is weaker the price will stop at the support or resistance level.
A price pattern gives more information about the balance and battle between S&R and momentum. For example, a continuation chart pattern (e.g. bull flag) may show that the S&R level can break if the momentum proceeds forward again.
Price action follows the movement of a river that flows down the mountain (the water of the river goes around big stones and moves aside small ones).
Clear vision of the market structure and the reliable trading system means understanding the notion of the path of least resistance. Understanding the structure and trading system is good for discretionary and system traders as traders can filter out setups indicating less potential to succeed and concentrate on setups that are more likely to succeed.